|
PRB 00-27E CANADA'S PRODUCTIVITY
AND STANDARD OF LIVING:
Prepared by: Daniel J. Shaw TABLE OF CONTENTS A. Canada’s Productivity Record B. The G-7 Countries’ Productivity Performance C. The Canada-United States Productivity Gap THE CAUSES OF CANADA’S POOR PRODUCTIVITY PERFORMANCE A. Insufficient Capital Accumulation B. The Computer-Productivity Paradox C. The Innovation Gap between Canada-U.S. Manufacturing D. Globalization, Foreign Direct Investment and Free Trade E. Productivity in Small and Medium-Sized Manufacturing Companies PRODUCTIVITY-COMPETITIVENESS-PROSPERITY LINKAGES A. Canadian Business Sector Competitiveness B. The Canadian Standard of Living C. Reconciling Productivity and Standard of Living Performances CANADIAN PRODUCTIVITY AND STANDARD OF LIVING PROJECTIONS CANADA'S PRODUCTIVITY
AND STANDARD OF LIVING: For most of the 20th century, Canadians have seen their standard of living improve steadily and at a breath-taking pace comparable to that of the United States. As a consequence, Canada emerged from World War II as the second-wealthiest industrialized country in the world. In fact, those who look beyond the economic data to measure well-being – which would further include other social indicators such as health and education, as does the United Nations – often conclude that Canada is the best nation in which to live. Canada’s well-crafted social union – based on the principle of sharing our economic success between regions, provinces and people – certainly deserves much credit for this situation. However, when we strip away the social data and look solely at the economic data relating to well-being, which is after all the fundamental building block of these indices, a very different picture emerges today. Canada is no longer atop this economic pyramid. Canada is not only not the second-wealthiest nation anymore, it is not even in the top ten among the industrialized countries. Since the end of World War II, Canada has seen its standard of living erode by comparison to other advanced countries, such as West European states, selective “Asian Tiger” nations and, in the 1990s, even the United States, as a result of our declining growth in productivity relative to these countries. In comparison to its chief competitor countries, Canada – at the start of the third millennium – has in some respects been slow to adapt its institutional matrix to the new economic environment, which is characterized by the process of globalization and the emergence of a knowledge-based economy. As a result, Canada depends too heavily on its cheap dollar vis-à-vis the U.S. dollar for a respectable competitive position in world (mainly U.S.) markets, which essentially means that we have lowered the external value of our wages and incomes to get more economic activity and closer to full employment. However, no country ever got rich by taking a national pay cut, which is what is implied by a depreciating currency; and, more importantly, this economic strategy does not bode well for the broader social index of well-being because we risk losing our long-standing ability to redistribute our retrenching wealth. The purpose of this paper is to: (1) provide a recent historical overview of Canada’s productivity record vis-à-vis the G-7 countries, particularly the United States; (2) advance plausible explanations for this performance, including the contributions of well-known economic determinants of productivity; and (3) provide the link between productivity and the standard of living. Using the most recent established trends, a general projection for the first decade of the third millennium will be ventured. A. Canada’s Productivity Record Providing a definition of “productivity,” a term that is not universally understood, is a useful start to the study of this topic. A general interpretation of the term “productivity” is that it is one of a number of key indicators of the vitality or strength of an economy, and possibly the most fundamental determinant of long-term economic growth. It measures the relationship between the physical volume of goods and services produced and the resources used in the production and transactions processes adopted by that economy.(1) Productivity is the measure of the efficiency with which people, capital, resources and ideas are combined in the economy. Accordingly, the country that integrates capital and talent in the most effective way will be the world’s leading economic powerhouse. There are two widely accepted measures of productivity. The most easily understood of these is labour productivity, which is simply the amount of output produced by an economy divided by the amount of labour employed (either in terms of working persons or hours worked) in that economy. However, as a partial productivity measure, it can be influenced by more intensive use of other inputs, most notably capital but also natural resources (possibly at the expense of the environment if not carefully and properly integrated into decision-making). The second is a broader concept that is known as the multifactor productivity or total factor productivity measure, which bundles labour, capital and intermediate inputs (inventories, energy, materials and supplies) together into a single input statistic. This measure cannot be observed directly, but indirectly by tracking the growth of outputs and inputs and assigning any residual output growth not explained by input growth to an improvement in multifactor productivity.(2) With this understanding, we can now evaluate Canada’s productivity record. Labour productivity, as measured by gross domestic product (GDP) in constant 1992 dollars per hour worked, was $26.40 in 1976; by 1999, it amounted to $34.06. Although this performance points to increasing labour productivity levels in the economy over the past 25 years, the implied average annual growth rate does not appear stellar; its compound annual growth rate was only 1.1%. Labour productivity in the manufacturing sector, by comparison, was $20.52 in 1976, but by 1999 it was $31.36. The manufacturing sector thus displayed considerably more growth in productivity in the 1976-1999 period (1.9% per annum) than did the economy as a whole. The closing of this gap can, in part, be attributed to free trade, as will be discussed when we venture explanations for Canada’s recent performance. For a good picture of this performance, see the graph in Figure 1 which provides the rates of growth of both productivity measures in the business sector since 1966. The data are divided into four periods commensurate with the business cycles experienced by Canada over this time; this purges the statistics of any cyclical bias. The trends in both measures are similar. Between 1966 and 1973, Canada enjoyed a favourable rate of growth in productivity, approaching 4% per annum in terms of labour productivity and more than 2% in terms of multifactor productivity. Since this time, however, Canada’s growth in productivity has hovered just above 1% in terms of labour productivity and just below 1% in terms of multifactor productivity. Figure 1
Source: Statistics Canada Although Canada’s productivity performance since 1973 is somewhat discouraging, little light can be shed on the nature and extent of the problem without first attempting a multi-country comparison. Without such a comparison, we simply cannot tell if this poor performance was specific to Canada or general to the industrialized world and beyond our control. B. The G-7 Countries’ Productivity Performance Canada’s comparator economies would, of course, be its partners in the G-7 countries; however, a detailed comparison of productivity between these countries cannot be attempted because of different data definitions and statistical methodologies.(3) For example, the way these countries calculate multifactor productivity, particularly with respect to the estimates of the capital stock, differs significantly. Indeed, many statisticians have problems even with Canada’s capital stock estimates because they appear excessively volatile. Furthermore, because these estimates do not include land and inventories that tend to grow at a slower pace, whereas the U.S. data does, Canada’s multifactor productivity measure overstates the contribution of capital accumulation to growth. Therefore, the analysis in this paper is restricted to labour productivity levels and growth rates, although even here a compromise is needed. The ideal indicator of labour productivity would include the number of hours worked, but only statistics on the number of people employed are widely available across the G-7 countries. Figure 2
Source: Organisation for Economic Co-operation and Development Figure 2 captures the performances of G-7 countries in terms of growth rates for labour productivity between 1960 and 1997. In this period, Canada outperformed only the United States; as a result, its performance was well below the G-7 country average. However, a more complete picture of labour productivity emerges when productivity levels, not just their growth rates, are evaluated. Figure 3 illustrates labour productivity levels of the G-7 countries in 1999, but, before getting too far ahead, it would be informative to step back and remember that the United States and Canada were by far the world’s most productive countries at the end of World War II.(4) The devastation of European and Japanese industries in the aftermath of this war would give an initial advantage to North America; however, this situation was expected to erode over time as these countries re-established their pre-war status. The data from Figure 3 confirm these expectations. European and Japanese productivity levels have converged to those of North America; their industries have continuously upgraded their production capabilities with the development and importation of best practice technologies from around the world. Figure 3
Source: Organisation for Economic Co-operation and Development Because Figure 3 measures productivity on a per worker basis, the gap between Canada and the United States is somewhat overstated when compared to productivity measured on a per hour worked basis. On the other hand, Canada’s performance relative to that of the European members of the G-7 countries is slightly overstated.(5) The data are, nevertheless, clear and unequivocal: the United States remains the most productive country in the world, but Canada no longer holds second place. Italy and France are respectively the second and third most productive of the G-7 countries. Canada is in fourth place, although this may be a temporary phenomenon because Germany is in the midst of reunifying and integrating the moribund East part of the country to the very productive West. C. The Canada-United States Productivity Gap So far, this review of Canada’s productivity performance has revealed nothing new or unexpected. We must now explore for the possibility that the aggregate productivity data somehow mask the performances of specific sectors where public concern is warranted. In this case, a Canada-United States comparison will suffice because the business sectors of these countries are the most comparable; we are also each other’s largest trading partner and primary competitor country on world markets in a number of traded commodities and manufactured goods. Figure 4
Source: Statistics Canada and U.S. Bureau of Labor Statistics Figure 4 presents the Canada-United States productivity gap between 1977 and 1999. Canadian labour productivity underperformed relative to that of the United States during this period. The average Canadian worker who produced just under 90% of what the average American produced in 1977 produced little more than 80% of what the average American worker produced in 1999. Similarly, the average Canadian worker employed in the manufacturing sector produced 90% of that of the average American manufacturing sector worker in 1977, but he or she produced only 67% in 1999.(6) The productivity gap between Canadian and U.S. manufacturing sectors appears to manifest itself more in small and medium-sized enterprises (SMEs).
This is particularly troubling because SMEs are largely responsible for the increase in business start-ups and employment in Canada over the past three decades. Indeed, when this trend is combined with the observation of a lower physical capital investment rate that may be the leading cause of poor productivity in Canadian manufacturing, knowing full well that SMEs have lower capital-to-labour ratios relative to large companies, the composition or structure of the Canadian manufacturing sector immediately looks suspect. It could very well be that the small size of Canadian manufacturing companies explains a good deal of the Canada-United States productivity gap in manufacturing. THE CAUSES OF CANADA'S POOR PRODUCTIVITY PERFORMANCE Three aspects of Canada’s poor productivity performance need explanation. The first involves the sets of factors that have contributed to the decline of productivity growth rates across the industrialized world since 1973. These would include lower investment rates in physical capital, particularly in machinery and equipment (M&E), and the (so far) unrealized productivity gains from extensive investments made in computer or information and communications technologies (ICT). Canada likely shares these causal factors with other countries of the industrialized world. The second aspect concerns the factors that led the Canadian manufacturing sector to lose pace with that of the United States since the late 1970s, thereby enlarging the pre-existing productivity gap between the two countries. Canada’s productivity experts seem to agree that, rather than the entire manufacturing sector, two subsectors are primarily to blame: (1) the electrical and electronic equipment subsector, and (2) the industrial and commercial machinery subsector. The probable sources of this gap are: a deficiency of R&D; a Canadian failure to access U.S. product and production process knowledge in a timely fashion; and slowness to adopt new technology. A more debatable contributor to the innovation gap is the relative loss in foreign direct investment (FDI) in North America, an important factor on which Canada has traditionally relied for accessing and diffusing productivity-enhancing technologies and products. On the positive side, the Canada-United States Free Trade Agreement (FTA) has been identified as having enhanced the Canadian manufacturing sector’s productivity growth. Finally, the third aspect deals with SMEs, particularly those that are Canadian owned, and their contribution to the widening of the productivity gap in manufacturing. The causal factors of these last two aspects of productivity are likely to be unique to Canada. All of these explanations will be investigated in turn. A. Insufficient Capital Accumulation A slow pace of capital investment can be seen to have led to a lower growth rate in labour productivity across the industrialized world. In some sense, this seems obvious; because people are more productive when working with more and better tools, lower growth in the capital-to-labour ratio as a result of lower capital investment translates into lower growth in productivity. However, there may be more here than meets the eye. It has been estimated that about 80% of all technical progress comes from, or is embodied in, new machinery and equipment.(8) Thus, significant and protracted lower investment in physical capital – regardless of any change in the capital-to-labour ratio – may result in lower productivity growth through a stunted rate of technical progress in the economy. Another way of looking at this is to consider the average age of the capital stock. It is generally understood that new capital, particularly that classified as M&E, is more likely to embody newer and best practice technologies than is older capital. Thus, an aging capital stock (which may result from a lower capital investment rate) can reduce productivity growth simply because technical progress (at least 80% of it) is coincidentally stunted.(9) Indeed, the mere slowing of the decline in the average age of M&E (i.e., not simply an aging M&E) can slow both the rate of technical progress and productivity growth in the economy. Researchers have confirmed the existence of this development, often referred to as the vintage effect, and made preliminary estimates of its deleterious economic impact.(10) Finally, because new physical capital often implies complementary worker training, a decline in capital investment may also entail a reduction in human capital investment – another positive correlate of productivity. Thus, both the direct and indirect effects of a lower rate of fixed capital formation can lessen the growth of productivity. The Organisation for Economic Co-operation and Development (OECD) is the best source of information on net investment. It reports that net investment – net of depreciation charges – for its member countries hovered in the vicinity of 12% in the 1970s, 10% in the 1980s, and trended down to about 5% in the 1990s. These data are pointed in the same direction as productivity growth of the industrialized world, thereby suggesting lagging investment as a contributing factor. B. The Computer-Productivity Paradox From the perspective of the business sector, the 1990s decade was particularly noteworthy for the investments made in information and communications technologies (ICT). Indeed, virtually all industries and sectors of the Canadian economy made considerable investments in ICT in the 1990s in the hopes of modernizing their operations and offices; the general understanding was that this would raise productivity levels. Firms across the industrialized economies of the world followed the same investment pattern. The Centre for the Study of Living Standards, however, reports only on the Canadian service sector circumstance:
Table 1 provides further evidence, broken down by subsector. As this poor productivity performance relative to ICT investment is largely mirrored elsewhere in the Canadian economy and evidence appears at best mixed when using data from across the industrialized world, one is left to question the promise of what has been described by the pundits as the ICT dynamo.(12) As one notable productivity expert, Robert Solow, put it: “We see computers everywhere but in the productivity statistics.” This unexpected development, labelled by some economic researchers as the computer-productivity paradox, has been explained in the following way. Major technological innovations in the workplace – such as the computer, communications technologies and peripherals – require considerable time before they are diffused throughout the economy and before they can be operated effectively and efficiently. This explanation suggests an analogy with electricity, which took more than 40 years, until the 1920s, before demonstrating any appreciable productivity improvements.(13) Table 1
Source: Centre for the Study of Living Standards, Productivity: Key to Economic Success, Table 8, p. 35. The lag in productivity improvements from investments in ICT may be due to the difficulties in effective implementation of the new general-purpose technologies, which are often institutional in nature, in contrast to incremental technology improvements. Indeed, if these barriers did not go beyond the simple issues of affordability and worker training, they would have largely been overcome by the power of computers, as it increased by leaps and bounds, and the rapidly decreasing prices in the past two decades. Institutional changes, however, cannot take place overnight and sometimes require younger generations to fully execute. Human nature is just not as flexible, adaptable or even amenable to fundamental change as is often required by the new technologies, and its timeframes for adjustment are clearly more protracted. It has been suggested that such institutional changes include:
History provides few precedents of such fundamental change to act as the basis for comparison or prediction. In a general way, we can conclude that the Industrial Revolution transformed small cottage businesses into large industrial complexes when it brought production out of the home and into the factory setting. The increased mechanization of the production processes required the loss of personal choice in determining the intensity, consistency and duration of one’s work effort through subjecting them to a decision-making hierarchy that assigned people to highly specialized activities in order to ensure continuous and coordinated throughput.(14) Today’s economies of scale and productivity gains could not have been realized otherwise.(15) Although people were well rewarded for this loss in sovereignty and their assignment to often mind-numbing activities, a professional class of negotiators emerged to ensure that the adopted factory disciplines did not stray too far from productivity considerations. Generic factory work rules became institutionalized and have come to be practised the world over, but this took a century or more. In contrast, contemporary business practices are allowing employees to work at home and to tele-commute to work, while, at the same time, enabling managers to spin off numerous business opportunities to smaller satellite ventures so that the firm can better focus on core activities. Hence, the Information Revolution appears to be de-scaling the activity levels of firms and putting work back into the home. The emergence of lean or flexible manufacturing techniques further orchestrated the dismantling of rigid work rules in favour of worker activism for taking advantage of the new-found human capital dimension of their job assignment.(16) Firms are also providing financial incentives to ensure workers’ continuous motivation and productivity, as well as attempting to tie down this “footloose” and intangible knowledge capital. Although these workplace changes will undoubtedly accompany ICT, they are likely to take considerable time before being fully implemented. It has since been suggested that we are on the cusp of a productivity boom in which the dawn of the Information Revolution is likely to be as powerful and relentless as the early stages of the Industrial Revolution. We can only hope that this is the case. C. The Innovation Gap between Canada-U.S. Manufacturing The striking element in Canada’s productivity performance is the fact that, overall, the business sector fared about the same as that of the United States for more than three decades. However, one significant sector – manufacturing – fared miserably. The value of manufacturing output represents approximately 20% of both economies and the similarity of these economies and their forces of change suggest, other things being equal, that their manufacturing performances should not have been so different.(17) What immediately stands out is the disparity between the productivity of the electrical and electronic equipment and industrial and commercial machinery subsectors of the two countries, with the United States decidedly superior.(18) Over a period of roughly two decades, this difference can have a significant impact on the structures of both economies. Only one telling conclusion can be drawn from these results. If we accept that the high technology sector is fuelling much of the increase in economic activity and productivity, and is responsible for propelling the economy towards a knowledge-based society, then the United States is farther along this road than is Canada. Viewed through these narrow lenses, the U.S. manufacturing sector appears to be far better prepared for the future and for the prosperity and challenges the Information Revolution may hold than is the Canadian manufacturing sector. Machinery and equipment manufacturing industries, largely belonging to high technology, are distinguished from most other manufacturing industries in that they are characterized more by product innovation than process innovation. Thus, the Canadian manufacturing sector’s poor relative productivity performance suggests that solutions might be sought in the product innovation policy area. For confirmation of this, we must look to: R&D expenditures; indicators of access to foreign sources of knowledge (for Canada, particularly the United States); and technology adoption rates. The OECD reports Canada’s gross expenditure on R&D as a percentage of GDP to be 1.6% in 1998, considerably below the OECD average of 2.2%. Significant R&D spenders are Japan (2.9%), South Korea (2.9%), Finland (2.8%), and the United States (2.7%).(19) The world leaders in R&D are thus spending as much as 80% more per dollar of GDP than is Canada. Amongst our comparator countries, Canada has the second-lowest R&D expenditures as a percentage of GDP among the G-7 countries. However, this situation may be partly due to factors beyond our control. R&D is relatively lower in small businesses than it is in large businesses, and Canada has more small businesses relative to the Americans. The second structural feature of the Canadian economy is the high degree of foreign ownership. R&D, like other central-office functions, is prone to be conducted in the home country. This is particularly true of the U.S. companies in Canada. When one combines this situation with the fact that foreign ownership in Canada is disproportionately high in technologically intensive industries, partly because the Americans are the technological leaders, Canada suffers from deficient R&D despite very generous tax incentives to engage in these innovative activities. One does not, of course, have to undertake R&D to enjoy its benefits; one can piggyback on the R&D of others. Innovations can be imported from abroad by purchase, entering into a licensing agreement, or being a recipient of FDI (foreign direct investment). One is constantly reminded that Canada represents less than 1% of the world’s population and is probably responsible for only about 2% of the world’s original ideas that can be used by industry. Consequently, Canadian R&D vastly understates the availability of new technology to Canadian industry, and its implications for economic welfare are even more important when one factors in the cost of this availability (foreign technologies are frequently much less costly).(20) Although it is difficult to evaluate Canadian access to foreign knowledge, a rather novel method was uncovered by Manuel Trajtenberg of the Canadian Institute for Advanced Research.
This disadvantage in the acquisition of knowledge dissipates with time, however. But hard evidence of insufficient technology adoption in Canadian manufacturing was provided in a 1998 Statistics Canada study:
So Canada again falls victim to its small size. D. Globalization, Foreign Direct Investment and Free Trade “Globalization” is the growing economic and political integration and interdependence of countries as a result of trade, investment, movement of persons, and the dissemination of knowledge. Multinational enterprises have been at the centre of this globalization process. These seemingly denationalized and borderless corporations, encouraged by recent advances in transportation and communications technologies, have begun to outsource the manufacture and assembly of selective (non-core competency) components of their complex products to affiliates and strategic allies across national borders, thereby taking advantage of the new trade environment sweeping the globe. In other words, the locations of critical stages of manufacture and assembly are being chosen to ensure that the entire production process more fully exploits competitive advantages wherever these exist, whether because of economies of scale, scope or learning by doing, or because of greater factor specialization. The business sectors of most industrialized countries have thus internationalized their activities, weaving an intricate web of linked activities around the world. The economic effects of these new global strategies extend beyond corporate competitiveness and profitability. Both inward and outward FDI convey substantial economic benefits in the form of productivity gains arising from increased factor specialization, the faster diffusion of new technologies and products to host countries, and increased competition for domestic companies. FDI is of increasing importance to Canada as a host country, but more as an outward investor. The outward stock of FDI originating from Canada has risen more than sixfold from US$22.6 billion in 1980 to US$156.6 billion in 1998, while its inward stock has risen more than two-and-a-half times, from US$54.2 billion to US$141.8 billion over the same period. Canada, in fact, became a net FDI exporter in 1997.(23) Moreover, the global integration of the Canadian economy that this investment entails also triggered increased specialization in the production of those goods and services in which the Canadian economy has a comparative advantage. This globalization process, which is allied with declining costs for communications and transportation, appears to have begun in the early 1980s, but it is unclear what to make of the accompanying trend for Canada to receive less FDI relative to the rest of the world. On the other most notable aspect of globalization, increased world trade flows were identified as a boost to Canadian productivity.
What is surprising, however, is that the FTA did not bring more prosperity to Canada. The economists and trade experts prior to signing the FTA were predicting a convergence in productivity levels between Canada and the United States. Obviously, other factors were at play and further research is warranted. E. Productivity in Small and Medium-Sized Manufacturing Companies The greater employment growth and poorer financial performance of SMEs relative to large businesses over this period suggest a slower growth rate in the capital-to-labour ratio of SMEs. This does not augur well for their labour productivity. Consider recent work (see Daly and Helfinger referenced above) which shows that the relative levels in value added per employee between large plants and small plants has shown a significant divergence from the early 1970s through to the mid-1990s. Moreover, relative to the United States, there has been a slight gain in Canadian large plants vis-à-vis the U.S. national average, but for the small Canadian plants there has been a dramatic drop from the national average. This pattern of lower productivity levels in the small establishments shows up also in lower wages, lower profits on average, etc. So there is a problem here in small business in terms of its productivity levels, particularly when the increases in employment have been so dramatic. The researchers’ data point to low productivity levels being heavily concentrated in small Canadian-owned plants. The productivity of large Canadian-owned plants was comparable to that of large foreign-owned plants in Canada; however, small Canadian-owned plants were only about two-thirds as productive as small foreign-owned plants. One explanation for this difference is the relative abilities of large and small businesses to access and adopt foreign R&D and technologies. Small Canadian-owned firms are at a disadvantage with small U.S.-owned firms.
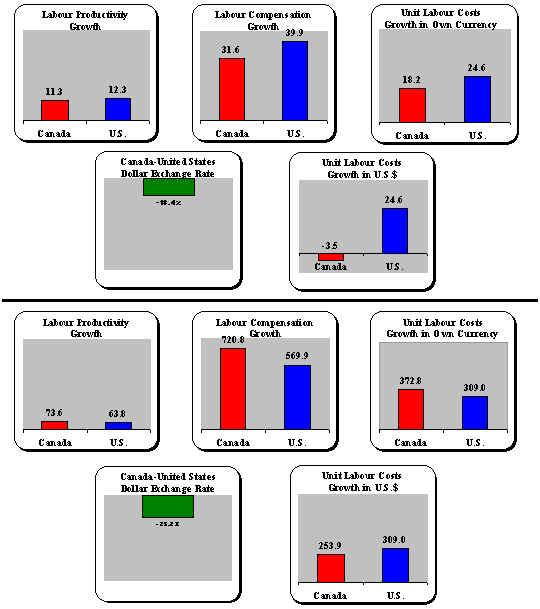
PRODUCTIVITY-COMPETITIVENESS-PROSPERITY LINKAGES The three terms – “productivity,” “competitiveness” and “prosperity” – can apply equally to people, firms, markets, or even society. In the modern economy, however, it is more useful to assign the concept of productivity to the firm, competitiveness to the marketplace, and prosperity to the nation-state. The rationale for this assignment is that an individual’s productivity is usually embodied in the products of firms; a firm’s competitiveness provides many industry-wide spillovers and may reflect common resource pools, competition policy and regulatory frameworks; and, finally, prosperity is usually distributed over the country by some measure of government intervention. There is also a hierarchical linkage between these terms. Productivity is a concept of the workplace because it is the foundation for competitiveness. The notion of competitiveness is a concept of the marketplace, where we are talking about relative costs that determine whether the operations of a firm are sustainable. Finally, prosperity is a societal concept relating to competitiveness through the latter’s ability to deliver improvements in real income, the quality of life, equity, and environmental integrity and sustainability. This hierarchy from productivity to competitiveness to prosperity means that productivity should not be viewed as an end in itself, but a means to obtain prosperity, where prosperity is taken to be something more than GDP per capita. A. Canadian Business Sector Competitiveness The link between the business sector’s productivity and its competitiveness – at least in terms of costs – is simple. With some knowledge of average wage and currency exchange rates, labour productivity can, by a mathematical equation, be converted into labour costs per unit – the traditional measure for comparing the competitiveness of rival countries’ business sectors. Indeed, comparing the performances of unit labour costs in a common currency over a significant period of time reflects fairly accurately the trends in the relative competitiveness of close competitor countries, such as Canada and the United States. Figure 5 illustrates the relative competitiveness of Canadian and U.S. business sectors in two periods: the 1989-1998 business cycle (the short term), and the past four business cycles, 1966-1998 (the long term). The base year in which the index is set at 100 for either period is 1966 and 1989. Although both periods saw the value of the Canadian dollar depreciate relative to that of the U.S. dollar, which made Canada the more competitive of the two, in every other respect the performances of the two sectors were different. Indeed, the periods can be marked for the reversals in relative performances of the two countries in terms of labour productivity, wages and unit labour costs in their own currencies. Figure 5 Productivity, Labour
Compensation and Unit Labour Costs, 1989-1998
1966-1998 Source: Statistics Canada. Over the past four decades, labour productivity in Canada has grown by 73.6 percentage points, which was 10 percentage points more than that in the United States. Canadian labour compensation exploded in this period, however, handing the U.S. business sector about a 150 percentage point gain. In one’s own currency, unit labour costs in Canada thus grew by 372.8 percentage points, which was 63.8 percentage points more than that in the United States. However, because the Canadian dollar depreciated by 25.2% in this period, this unit labour cost disadvantage was reversed in Canada’s favour by 55.1 percentage points when converted into U.S. dollars. Alternatively put, the competitiveness of Canada’s business sector improved by 13.5% relative to the United States business sector between 1966 and 1998. In contrast, in the 1989-1998 period, the competitiveness picture of the two countries was somewhat different as the growth in U.S. productivity outperformed that in Canada by one percentage point (12.3 versus 11.3 percentage points). Growth in labour compensation was more restrained in Canada in this business cycle, providing the Canadian business sector with an 8.3 percentage point advantage (31.6 versus 39.9 percentage points). In one’s own currency, unit labour costs in Canada thus grew by 18.2 percentage points, which was 6.4 percentage points less than in the United States. Again, because the Canadian dollar depreciated in the period, by 18.4%, the unit labour cost advantage was boosted further by 21.7 percentage points when converted into U.S. dollars. Alternatively put, the competitiveness of Canada’s business sector improved by 28.1% relative to the United States business sector between 1989 and 1998 due to restrained wage settlements and a depreciated currency. Both events were the result of depressed domestic demand and adverse terms of trade with the decline in international primary commodity prices in the 1990s. The Canadian dollar depreciated by 18.4% vis-à-vis the U.S. dollar in 1989-1998, providing more than 77% of the improvement in the cost competitiveness of the Canadian business sector vis-à-vis the United States in that period. A depreciating currency is, therefore, an extremely effective way of boosting competitiveness both in the short and longer term, but particularly the former. However, productivity increases – accompanied by no more than matching wage and salary increases (in a non-inflationary environment) – is the more effective competitiveness strategy because it does not involve a decline in the external value of wages, which is consistent with the objective of prosperity and an improving standard of living. B. The Canadian Standard of Living The standard of living is defined by the country’s GDP per capita, which, for Canada, in 1999 was estimated at $31,454. In comparison, the standard of living of the average American is estimated at $50,816 using a currency exchange rate of US67¢ per Canadian dollar, or $40,516 using an exchange rate of US84¢ as calculated by the OECD’s purchasing power parity formula. This PPP exchange rate formula tries to capture the relative buying power of different currencies in terms of a representative basket of goods. Using this formula, the difference in income per capita between Canada and the U.S. is more than $9,000 per year per person. If the prevailing exchange rate of 67¢ cents is used, this difference would be more than $19,000. Therefore, the standard of living gap between Canada and the United States is estimated to be between 22% and 38%, depending on which of these calculations is applied. Figure 6
Source: Organisation for Economic Co-operation and Development. Figure 6, on the other hand, provides a broader comparison, illustrating levels of standard of living of the G-7 countries for 1998.(26) Given that the United States had the highest productivity of the G-7 countries, it is not surprising that it is the country with the highest standard of living in the world. Although Canada was in second place among the G-7 countries at the beginning of the 1990s, it is now tied for third place with Japan, having being overtaken by Germany. The standard of living gap (in constant 1992 US$) between Canada and the United States has also widened in this period, by eight percentage points. C. Reconciling Productivity and Standard of Living Performances When one compares Canada’s ranking for standard of living amongst the G-7 countries in 1989 and 1996 to its ranking for productivity in 1989 and 1997, there is a similar showing. Canada fell from second to third place in the former ranking and from second to fourth in the latter. Furthermore, the Canada-U.S. standard of living gap of 20% in 1989 widened three percentage points by 1999, while the gap in productivity widened only one percentage point. Although there is an obvious link between productivity and standard of living, it is not a direct one. A precise mathematical formula does exist, however. Standard of living, or output (GDP) per capita, is equal to productivity, or output per hours worked, multiplied by the number of hours worked and divided by the number of people in the labour force multiplied by the labour force participation rate:
The two – output per capita and output per hours worked – should move closely together unless something happens to the second and third terms of this equation. Figure 7
Source: Statistics Canada. Figure 7 illustrates Canada’s productivity and standard of living performances over the past two business cycles using this mathematical formula. It explains the decline in Canada’s living standards in the 1990s. It is not because productivity deteriorated. In fact, if one looks at GDP per worker, there’s actually no significant deterioration at all in the 1990s compared to the 1980s. It has been the fall in the number of hours worked, primarily due to a rise in the number of unemployed and a shift from full-time to part-time jobs, and also, and even more importantly, due to the very large decline in Canada’s labour force participation. Consulting Figure 7, the growth rate of GDP per capita is smaller than that of labour productivity in 1989-1998 by exactly the sum of the declines in the labour participation rate, the employment rate and hours per job in the period. This is the exact opposite of the 1981-1989 period in which the growth in GDP per capita was greater than that of labour productivity. Labour participation, employment and hours per worker were all positive in that business cycle. Canada’s standard of living performance in the 1990s relative to that of the United States is also explained by these economic relationships. Canada’s standard of living fell relative to that of the U.S. over the 1990s because of a relatively weaker labour market performance, not a relatively weaker productivity performance. Actually, Canada almost kept up with the U.S. with respect to productivity growth rates over the 1990s, but we did not keep up to them with respect to standard of living growth rates. More than anything else, this may have been because of a worsening terms of trade (i.e., prices of exports divided by prices of imports) in the period. A decline in the terms of trade means much slower income gains and poorer employment prospects, both of which are borne out in the data. In terms of levels, though, more than 95% of the gap in the standard of living can be explained by the gap in productivity levels between the two countries; poor labour market conditions can only explain the remaining 5%. CANADIAN PRODUCTIVITY AND STANDARD OF LIVING PROJECTIONS This paper devoted a lot of effort to digging up the past, then taking us to the present in terms of productivity, competitiveness and standard of living. Projecting the future course of these social indicators is all that remains. At first glance, it is tempting to simply extrapolate Canada’s historical performance out a decade or two. This is the easiest way of tackling the problem. In fact, John McCallum, former Chief Economist of the Royal Bank of Canada, chose this route and offered the following conditional prediction: if trends established in the 1990s are projected out to 2010, Canadians’ standard of living will decline to 50% of that of Americans.(27) This conclusion is quite straightforward and provides Canadians with a clear wake-up call that is intended to stimulate public discussion of policy changes to arrest and reverse this sorry decline. Although it is hard to find fault in the motives and intended effects of taking this course, this paper prefers to take a different route. There is clearly enough evidence, even in this short treatise, to conclude that the assumed condition of the above prediction is not likely to occur. Economic trends of the 1990s are unlikely to continue into the first decade of the 21st century. In fact, trends in key economic indicators of productivity and standard of living of the last half of the 1990s were different than those of the first half. They are simply getting better and are more encouraging. The terms of trade improved remarkably in 1999 and 2000. Investment in physical capital, most notably machinery and equipment, is now up significantly from the early 1990s. The labour market is expanding both in terms of the labour force participation rate and a declining unemployment rate. Consequently, these more recent labour market developments will likely force standard of living growth rates back in line with productivity growth rates and this should be sufficient to arrest the widening of the standard of living gap between Canada and the United States. The pivotal public policy question remaining is really whether the resurgence of the Canadian productivity growth rate of the past year (2.2% in the first half of 2000) is the beginning of a trend and is not merely cyclical in nature. If the answer to this question is “no,” then the pessimists will likely have their day. On the other hand, if the answer is “yes,” Canada will likely improve its productivity relative to the United States. The latter forecast has a better probability of occurrence if the resurgence in U.S. productivity, which is related to protracted computer-related investments by the business sector, ever materializes in Canada. Canadian business sector investment in information and communications technologies has lagged behind our U.S. competitors, which suggests that the payoff in the form of higher productivity levels and growth rates that are linked to the Information Revolution is likely right around the corner for Canada. Finally, this paper was limited in the sense that it provided a cursory look at the possible explanations for Canada’s productivity performance. It did not go deeply into all the determinants of productivity, most notably omitting those with a public policy dimension. However, this paper did hint at a positive contribution made by Canada’s trade policy to productivity in the manufacturing sector, most notably the FTA. Positive change in the course of other government policies related to taxation, regulation, research and development, and human capital development – if they are significant and stable over the longer term – could also conceivably narrow the long-standing Canada-U.S. innovation, productivity and standard of living gaps. (1) If this type of measure suffers from a weakness, it is that it inadequately accounts for quality improvements of products and insufficiently records the contribution of technology enhancements. It, therefore, understates Canada’s true productivity growth over longer periods. (2) The choice between the two measures is usually governed by the intended use. Labour productivity is a superior measure of productivity from the point of view of living standards because they are more closely related. On the other hand, the multifactor productivity measure is better equipped to review and evaluate resource allocation decisions of firms, industries, sectors or economies. (3) There are a number of measurement problems, the first of which concerns the independence of output and input measures – a particular problem of service industries that construct output indices based on input measures. The second involves the use of chained or fixed-weighted index numbers when comparing price or quantity of two different periods. Most economist-statisticians prefer the chain-weighted index as it is better able to capture changes in relative price structures. To date, only the United States has adopted chain-weighted indexes. (4) This figure is based on an index of productivity levels with the United States set at 100. For purposes of direct comparison, all G-7 country productivity values are converted to U.S. dollars according to 1999 purchasing power parity (PPP) formulas. (5) Americans work more hours per week than do Canadians. On average, Canadian manufacturing employees work 37.5 hours per week, while American manufacturing employees work about 42 hours. The average North American worker also works more hours per week and more weeks per year than does the typical European. The implications for the above productivity data are that if you take a given number of employees and you work them longer hours (within limits), you will achieve productivity gains. (6) The United States has recently revised its data so that computer software investments are treated as a capital expense that depreciates over its expected life rather than as consumption expense. Canada has not made such a revision. To some extent, this tilts American productivity levels disfavourably in the earlier period (1950-1980) and favourably in the later period (1980-1999), suggesting the better U.S. performance over the study period is partially a statistical artifact. (7) Donald Daly and Michael Helfinger, Small Business in Canada – U.S. Manufacturing Productivity and Cost Comparisons, Centre for the Study of Living Standards Conference on the Canada-U.S. Manufacturing Productivity Gap, 2000, p. 14. (8) J.B. DeLong and L.H. Summers, “Equipment Investment and Economic Growth,” Quarterly Journal of Economics, 106, 1991, pp. 445-502. (9) Furthermore, an aging capital stock implies higher repair and maintenance charges per unit of output; and a diversion of resources from other productive activities to repair and maintenance is certainly not conducive to the growth of productivity. (10) See S. Gera, W. Gu and F.C. Lee, Capital-Embodied Technical Change and the Productivity Growth Slowdown in Canada, Industry Canada, Working Paper No. 21, 1998, pp. 11-12. (11) The Centre for the Study of Living Standards, Productivity: Key to Economic Success, March 1998, p. 32. (12) For a review of international studies of ICT and productivity, see S. Gera, W. Gu and F.C. Lee, Information Technology and Labour Productivity Growth: An Empirical Analysis for Canada and the United States, Industry Canada, Working Paper No. 20, March 1998. (13) The better distribution and conveyance of power by electrical means permitted factories to: (a) locate at greater distances from waterways; (b) rather than being built in three-story cube-like designs, become longer and more rectangular in shape to make way for Fordist-like assembly production lines; and (c) shift from downtown city cores to outlying industrial parks to obtain greater real estate for these larger factories. In this case, manufacturers were not willing to immediately abandon their existing plant and equipment. Only once their facilities had become significantly depreciated and outdated, did it become financially feasible to take full advantage of the productivity benefits of electricity by implementing these restructurings. (14) Because an individual’s productivity had become highly dependent on that of colleagues in such a setting, one could argue that the surrender of such decision-making to a shopfloor manager was to ensure that these colleagues would not shirk their assigned tasks. Thus, direct authority superceded contractual relations as the dominant governance mechanism. (15) The key principles behind mass production techniques are product and component part standardization, special-purpose equipment and the elimination of skilled labour on the assembly line. (16) The key principles behind lean production techniques are: the “just-in-time” availability of components for assembly in order to economize on inventories; autonomous control of defects, whereby assembly line workers can stop the process when defects are found and until its source is identified and corrected in order to economize on “re-work” stations and costly manufacturer recalls; and the replacement of unskilled and specialized assembly line workers by multidisciplinary teams that would, through “quality circles,” further contribute to improvements in the production process. (17) The next section suggests that, in fact, other things may not have been equal. Both industries began diverging in their performances beginning in the late 1970s, probably because of the immutable forces of globalization and the ensuing specialization, but the FTA may have further contributed to the specialization in both economies. (18) The U.S. statistical agency, in calculating the productivity of the electronics industry, adjusted the real prices of these goods (i.e., computer products) for their quality differences (i.e., computational power, speed and other characteristics), whereas the Canadian data do not reflect this adjustment. This means that the price index for these products is rising faster in Canada than in the United States (actually, it has Canadian prices rising by 9% and U.S. prices falling by 51% between 1992 and 1995), thereby generating a greater growth rate in productivity in the United States than in Canada. The Canada-U.S. differential productivity in this subsector is, therefore, largely a statistical artifact, but not completely. Caution must be used when citing this subsector as a cause for the Canada-U.S. productivity gap; indeed, one should be wary of making too much of this disparity. (19) Organisation for Economic Co-operation and Development, Main Science and Technology Indicators, 1, 1999, Table 5. (20) It has been argued that, prior to 1973, U.S. R&D boosted Canada’s total factor productivity growth rate by about 0.9 percentage points and that this boost faltered to somewhere between 0.3 and 0.4 percentage points with the decline in U.S. R&D since 1973. See J. Bernstein and T. Mamuneas, The Contribution of U.S. Spending to Manufacturing Productivity Growth in Canada, presented at the Centre for the Study of Living Standards Conference, January 2000. However, there is one caveat. Strangely, this paper does not use control variables to account for other contributing factors to the productivity slowdown, such as depressed aggregate demand in Canada in the 1990s or the possibility that Canadian managers failed to tap into U.S. R&D when compared to previous periods, and, therefore, does not adequately separate out R&D capital as a potential explanation. (21) Daniel Treffler, “Does Canada Need A Productivity Budget?” Policy Options, 20, July 1999, p. 68. (22) J.R. Baldwin and D. Sabourin, Technology Adoption: A Comparison Between Canada and the United States, August 1998, pp. ix and 27. (23) United Nations, World Investment Report 1999: Trends and Determinants, 1999. (24) Daniel Treffler, “Does Canada Need a Productivity Budget?” 1999, p. 69. (25) J.R. Baldwin, E. Rama and D. Sabourin, Growth in Advanced Technology Use in Canadian Manufacturing During the 1990’s, Statistics Canada, 11F0019MPE No. 105, 2000, p. 24. (26) This diagram is based on an index, with the United States set at 100. For purposes of direct comparison, all G-7 country GDP per capita values have been converted to U.S. dollars. (27) John McCallum, “Will Canada Matter in 2020?” Current Analysis, Royal Bank of Canada, February 2000. |