|
82-4E
YOUTH UNEMPLOYMENT IN CANADA
Prepared by: TABLE
OF CONTENTS C. Policy
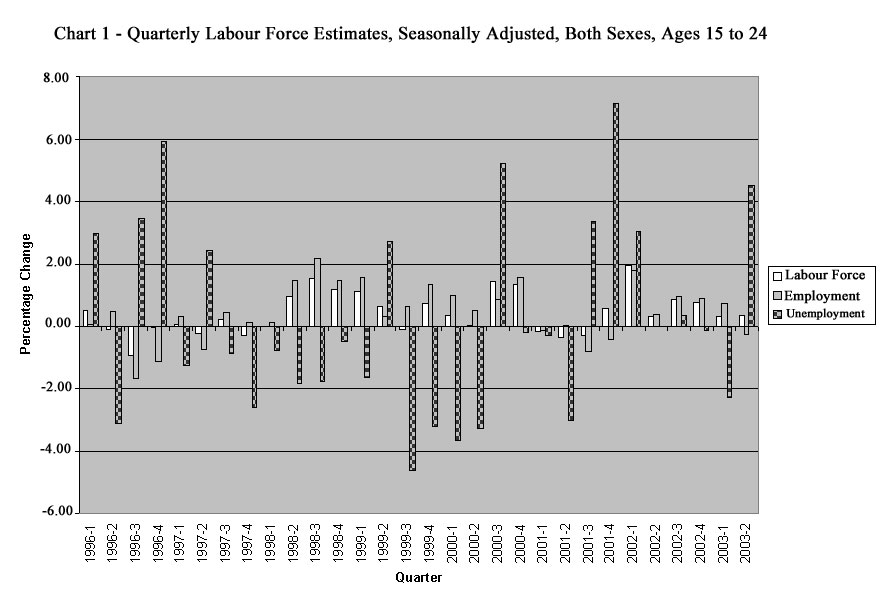
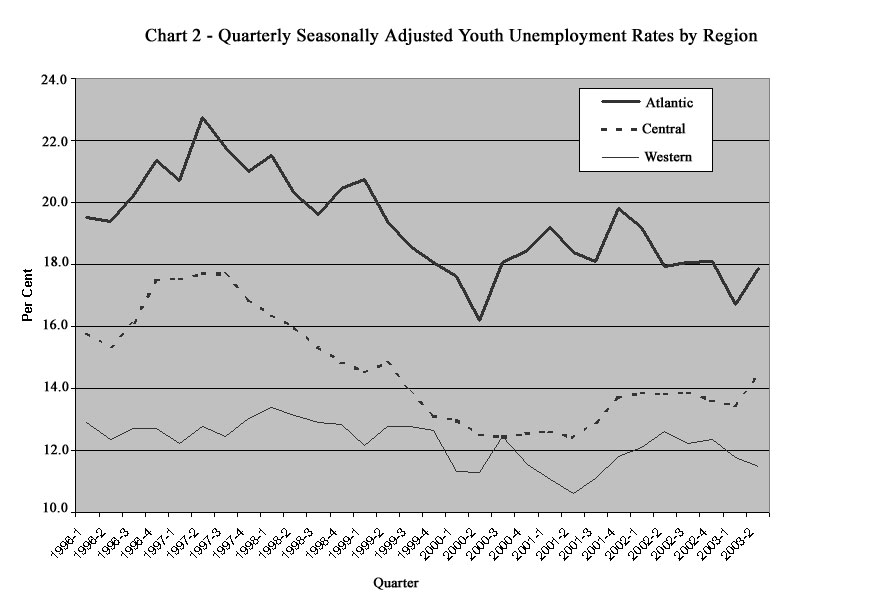
Induced Unemployment D. Recent Developments in the Youth Labour Market YOUTH UNEMPLOYMENT IN CANADA* For many young individuals (those aged 15-24), the transition from school to work means entering the labour market relatively unskilled, inexperienced, unfamiliar with job search and unaware of the job opportunities open to them. Consequently, many of them face the possibility of unemployment during their initial years as members of the labour force. This negative correlation between age and unemployment is well documented in many countries and, as evidenced by the level of youth unemployment in this country, Canada is no exception. While this relationship persists, its strength, proxied by the youth/adult unemployment rate ratio, has diminished over the past 20 years. It should be noted, however, that youth unemployment relative to that of adults has worsened since the 1990-91 recession. Trends in youth unemployment rates by age, sex and region may be found on pages 16 and 17 of this review. Despite the relatively high level of public attention given to the issue of unemployment, this attention seldom addresses the various types of unemployment and their underlying causes. This paper attempts to do this with respect to present-day youth unemployment. The labour market is most easily perceived as one big market housing both demanders (employers) and suppliers (workers) of labour. It should be borne in mind, however, that suppliers in this market are non-homogeneous, the most distinguishing feature of importance here being that of age. Demanders and suppliers are constantly searching for each other: the former seek to purchase the productive services of labour while the latter seek to sell them. The impetus behind this process is the wage rate or the price of productive services. However, for a number of reasons this process is not instantaneous and requires varying amounts of time to pass before being realized. Consequently, some suppliers encounter periods of unemployment. These periods of unemployment vary in frequency and duration depending on workers’ skills, the nature of jobs, the level of economic activity and the structure and operation of the labour market itself. The supply of labour or the size of the labour force consists of those who are employed as well as unemployed. Unemployment as defined by Statistics Canada is experienced by those (15 years of age and older) who during the reference week of the survey: were unemployed and actively seeking work; had not actively searched for work in the past four weeks and were expecting to be recalled from a layoff or, had not actively searched for work but expected to start a new job within four weeks. Throughout the 1970s, demographic factors were relied on as a major reason for the upward trend in youth unemployment. During this period, the active youth population (all individuals aged 15-24) grew substantially. As well, and this applies especially to young females, youth participation rates (a ratio of the youth labour force to the active youth population) also increased significantly during this period. The combined effect of these resulted in an unprecedented influx of young people into the labour force. Today, the size of the youth labour force is declining; the number of young individuals in the Canadian labour market has declined every year since 1982. Nevertheless, unemployment among those 15-24 years of age remains high, indicating that non-demographic factors also play a major role in this problem. The following discussion examines a number of factors that explain why young workers experience higher rates of unemployment than their adult counterparts. Probably the most familiar cause of unemployment is a depressed level of economic activity. Deficient demand or cyclical unemployment is a consequence of insufficient aggregate demand for goods and services and is in no way related to how well a labour force is trained or deployed. Since labour is required to produce goods and services, demand for it falls during a downturn in the level of economic activity. Generally associated with adverse business conditions, attempts to reduce the level of demand-deficient unemployment have generally required the use of traditional macroeconomic instruments, namely fiscal and monetary policies. By increasing government spending and/or money supply, governments can stimulate consumption and/or investment in order to raise the level of aggregate demand and consequently the demand for labour. However, the use of these policy instruments as vehicles to raise the level of employment may conflict with another and also very important policy objective; namely, a low and stable rate of inflation. This policy conflict stems from two underlying relationships: the rate of wage change is inversely related to the level of unemployment (the level of excess demand for labour) and the rate of change in prices is directly related to the rate of change in wages. Although this rather short explanation fails to incorporate the issue of inflationary expectations, it does provide the essence of the theoretical groundwork behind this policy conflict and what is often referred to as the natural rate of unemployment. Demand-deficient unemployment is usually viewed as an economy-wide problem and, if untargeted, attempts to generate jobs for the young stand little chance of success. In a situation of deficient demand adult workers are also laid off. Since adult workers are generally more marketable and attractive to employers at the going wage, they will be the first to be rehired as soon as the economy begins to experience the effects of the government stimulus. This notion has found some support in the United States where empirical evidence shows a relatively small reduction in youth unemployment during periods of government stimulus. Another type of unemployment linked to a situation of slack demand for labour is called seasonal unemployment. Its cause is related to seasonal factors rather than to a general malaise in the level of economic activity. The effects of seasonal factors on aggregate demand for labour are relatively small but tend to gain importance if examined in a regional context. The industrial and occupational mix in some regions of Canada is more evenly distributed than in others. Obviously, unemployment caused by seasonal factors will be much more pronounced in those regions that depend mostly on seasonal industries. Seasonal unemployment is also caused by seasonal effects on the supply of labour and it is here that the young are most concerned. At the end of each school year a large number of students enter the labour force intent on securing summer employment. Although many are successful in guaranteeing themselves a job before the school year ends, many are not and end up being included in the ranks of the unemployed while they search for a summer job. These jobless students often require more than a month of search before becoming employed. This is evidenced by the fact that the absolute number of unemployed youth peaks during the months of June and July. Over the years, the relative size of the returning student labour force has risen and many students seeking summer employment experience a period of unemployment. Although this is not thought to be overly significant, their numbers have tended to put upward pressure on the average annual number of unemployed youths. Governments offer a number of summer job creation programs for youth and their continued use helps to alleviate this seasonal component of unemployment among the young. At the federal level, the government allocates funds each year to help students secure summer jobs. It has committed $240 million to the summer student job program in 1997 and 1998. As already mentioned, labour market participants function in a very dynamic environment and require time before fully realizing their intentions. Hence it is not surprising that job vacancies and unemployed individuals co-exist. One reason for this is simply that fully qualified unemployed individuals have yet to find job openings. Individuals in this position are said to be frictionally unemployed. Job seekers gather information on available jobs, while employers select workers from among an array of job seekers. This search process is not costless (its cost being measured by lost production) and of course requires time. In the early 1970s, frictional or search unemployment was thought to account for a significant proportion of total unemployment in this country; at that time, it was estimated that frictional unemployment accounted for nearly one-third of Canada’s unemployment and its level was positively related to the degree of excess demand in regional labour markets (i.e., higher in the province of Alberta than it would be, say, in Newfoundland). Today, its impact on the unemployment rate is thought to be less pronounced as the relative influence of structural factors on unemployment in Canada increased over the last decade. Frictional unemployment is thought to be high among the young for a number of reasons. Initially most young individuals are inept at job search and require time to "learn" before search yields success. The young are also generally characterized as having a lower attachment to the labour force. They appear to have more alternatives to work than many adult workers and consequently withdraw from and re-enter the labour force more often. For example, a young person does not usually have the same financial responsibilities as most adult workers and consequently may elect to work for a while and then withdraw from the labour force, perhaps to travel or return to school. Whatever the reason, when young people return to the labour force most must actively search for work. It is suggested that frictional unemployment is high among the young because they have the most to gain. That is to say, their returns to search extend over a longer period, and attempts to market their initial years of skill acquisition and job experience will have the most pronounced effect on their lifetime earnings. When a young person first enters the labour market, he/she often has few marketable skills and other saleable characteristics (for example job experience) to offer prospective employers. As these individuals acquire marketable skills they begin to search for higher paying jobs. In many instances, these bouts of job "hopping" or "shopping" result in temporary periods of frictional unemployment. Another reason for the co-existence of job vacancies and unemployment is that unemployed individuals are not qualified to fill these vacancies, or are qualified, but unable to accept employment because they are geographically separated from the job. Individuals in this group are said to be structurally unemployed. The time distinction between frictional and structural unemployment is somewhat arbitrary; the latter generally referring to long-term unemployment. Structural unemployment is a very serious problem because it appears to be worsening and requires much more time to remedy. Industrial location, production techniques and consumption patterns change over time. As a result, labour as well as other factors of production must also change. If the qualitative characteristics inherent in the supply of labour or its location are too slow in making this adjustment, the result is structural unemployment. In the past, the supply of skilled (primarily blue-collar skills) labour has largely been accommodated through immigration. Canada’s lengthy reliance on a policy that encouraged a "buy" rather than "make" approach to skilled workers; our emphasis on formal training; the present-day cost of non-firm specific training, particularly in unionized firms; and a myriad of other reasons have all contributed to the present-day structural unemployment problem in this country. As mentioned earlier, a structurally unemployed individual is also one who is qualified but unemployed as a result of being geographically separated from available jobs. The distribution of economic growth across Canada is far from uniform, so some individuals are required to move if they are to secure employment in their respective occupations. Mobility is not a costless exercise and in many cases, although substantial monetary returns may be realized, it does involve a high degree of risk or uncertainty. As well, Canada is a large country and moves often mean separations from family and/or friends. Nonetheless, an efficiently operating labour market requires labour, especially if highly qualified and unemployed, to move to high demand locations. Structural unemployment of the immobile worker type is probably not as pronounced among young workers as among adults. Those unemployed youth who do possess skills needed elsewhere are generally viewed as being more flexible and adaptable than adult workers and consequently in a better position to move. As well, while mobility provides financial rewards for most, the period of return for members of this group is longest and therefore they have more to gain by moving. However, this is not intended to suggest that structural unemployment of this type eludes the young. A frequently cited reason for the effect of this type of structural unemployment on youth involves the issue of unemployment insurance (U.I.), a subject which is discussed further below. Despite the steady improvement in the relative labour market position of young workers since the beginning of the last decade, many Canadians believe that today’s youth face a more uncertain future in their quest to secure meaningful jobs and economic security. While evidence suggests that some young workers face a difficult future, this prognosis does not appear to be valid for young workers generally. The gap between the unemployment rate for youths with a university degree and the unemployment rate for all individuals with a university degree was 4.6 percentage points in 1998. Using the same relative comparison, the labour market position of youth who did not complete high school produced a gap of 8 percentage points. It appears that the productive characteristics of young, less educated workers do not match the requirements of the labour market. And the trend toward rising skill requirements will undoubtedly prove increasingly problematic for early school leavers in the future. Human Resources Development Canada estimates that between 1995 to 2000, approximately one-fifth of the new jobs created during this period are expected to require management skills, 20% are expected to require a university degree, 20% will require a community college degree or trade certification, and almost one-third are expected to require high school completion. In other words, those who have not completed high school will continue to face limited employment opportunities. In 1998, early school leavers accounted for 43% of the total number of unemployed youth; this group registered an unemployment rate of 22.7%, 1.5 times the annual average rate for all youth. C. Policy Induced Unemployment Not long after the U.I. revisions of 1971, it was said that the program was impeding "normal" behaviour in the labour market. On the demand side, the program allows employers to keep their labour forces attached during a temporary downturn and thereby forgo the costs of recruiting and training workers once production returns to its normal level. Knowing that workers’ incomes are partially protected, encourages employers to resort to layoffs more frequently than would otherwise be the case. More important, however, is the program’s effect on the supply side. For unemployed workers the program is intended to provide income assistance in order to facilitate longer and more effective periods of search. However, because of the level of assistance, entrance requirements and the program’s benefit structure, some argue that this has led to an increase in both frictional unemployment and structural unemployment of the immobile worker type. It is argued that frictional unemployment has risen because U.I. benefits induce some individuals to consume paid unemployment more frequently and for longer periods. As well, it is thought that the program has attracted some individuals into the labour force merely in order to become eligible for benefits. Many argue that structural unemployment has risen because unemployment insurance reduces the financial incentive for some individuals to move to high demand areas in need of their skills. Consequently, the duration of their unemployment is extended. This is considered to be most pronounced among unemployed individuals living in areas where benefits have been extended due to a higher unemployment rate in their local labour market. While the U.I. program has undoubtedly proven beneficial for many individuals across this country, most studies of its effect on the labour force conclude that the 1971 revisions led to an increase in aggregate unemployment. One study that examined this issue with respect to youth suggests that the U.I. revisions of 1971 have also had some effect on the level of youth unemployment, and this is most pronounced among females aged 20-24. In July 1996, the Unemployment Insurance Act was replaced by the Employment Insurance Act (EI). Under the new insurance system, benefit eligibility and duration are based on hours, rather than weeks, of insured employment. For many, this change effectively raised the entrance requirement. This was particularly true for new entrants and re-entrants as their entrance requirement was raised from 20 weeks of insurable employment (at a minimum of 15 hours per week) to 900 hours. Maximum weekly benefits were reduced and weekly benefits are now averaged over a fixed period called the rate calculation period, whose duration depends on the regional rate of unemployment. The benefit rate under EI is 55% of average insurable earnings; however, this can decline to as low as 50%, depending on a claimant’s claim history. In terms of program financing, the EI Account may now maintain a surplus so as to minimize fluctuations in premium rates over the business cycle. In conjunction with the major provisions outlined above, the reconfiguration of the insurance system provides guidelines for the delivery of employment benefits (previously referred to as unemployment insurance developmental uses). Financial assistance under employment benefits includes grants, contributions, loans and vouchers. Those eligible for these benefits include, in addition to those currently eligible for regular benefits, those who received regular benefits in the past three years and those who received maternity or parental benefits in the past five years. In May 1996, the Minister of Human Resources Development extended an offer to all provincial and territorial governments to assume responsibility for employment benefits. Needless to say, since 1971, unemployment (employment) insurance has undergone a number of modifications, many of which were designed to reduce the program’s disincentive effects. According to a recent Department of Finance working paper, the disincentives associated with the current program are similar to, or less extensive than, those that existed prior to the 1971 reform. Another policy measure that is particularly relevant to the issue of youth unemployment is minimum wage legislation. Most of the legislation affecting the covered sector (those employees covered by minimum wage legislation) is provincially controlled; however, the federal government does control minimum wage legislation covering workers under the Canadian Labour Code. Minimum wages can theoretically lead to an increase in employment if firms in the covered sector are non-competitive in the labour market. This refers to a case where a firm can control the price it pays for labour because it is the only buyer (monopsony). In practice however, the monopsonist argument favouring minimum wage legislation would not appear to be extensively supported. Hence, a minimum wage which exceeds the competitively determined rate will tend to reduce the level of employment in the covered sector (labour displacing effect). Low wage workers in the covered sector are generally characterized as being unskilled, untrained and in many cases less attached to the labour force. Consequently, less experienced youth with similar characteristics must compete with more experienced adult workers for employment. It should be noted, however, that some provinces have established sub-minimum wage rates (i.e., minimum wage rate for certain categories of workers, such as young workers). The intent of such rates for youth is to reduce the level of competition with adults. In most cases, however, this differential applies to employees under 17-18 years of age; thus, no competitive differential exists for a majority of young workers. Evidence of the effects of minimum wages on aggregate unemployment is somewhat mixed, although most studies unambiguously support a labour displacing effect. One study that attempted to measure the effect of minimum wages on teenage unemployment concluded that over the 1956-75 period, minimum wages increased unemployment among males and females by 0.8 and 1.6 percentage points respectively. Over the years, minimum wages have undoubtedly increased the incomes of some workers, but they have also constrained the level of employment in the covered sector. Although minimum wage rates in most jurisdictions declined by comparison with the average industrial wage throughout the 1980s, some jurisdictions (e.g., B.C. and N.W.T.) have substantially increased the minimum wage rate since the early 1990s. This is particularly true in the case of the federal minimum wage, which became aligned with the general minimum wage rate in each province and territory as of 1 July 1996. As a result of this change, the federal minimum wage rate increased from $4.00 per hour to a low of $4.75 in Newfoundland and a high of $7.00 in British Columbia. As this measure does not accommodate sub-minimum wage rates for youth, the impact of this change is expected to be greatest among young workers. D. Recent Developments in the Youth Labour Market As illustrated in Chart 1, the youth labour market witnessed a marked improvement over the latter half of 1999. Between the 2nd and 4th quarters of 1999, the number of employed youths increased by 2.1% (45,000). The proportion of those 15 to 24 years of age who were employed - the employment rate - increased during this period by almost one percentage point to reach a seasonally adjusted level of 55.3% by the final quarter of the year. The number of unemployed youths also fell during the latter half of 1999, with the biggest decline occurring in the 3rd quarter, as illustrated in Chart 1. Between the 2nd and 4th quarters of 1999, the number of unemployed youths dropped by 29,000 (7.7%). The combination of strong job growth and lower unemployment served to reduce this age group’s seasonally adjusted unemployment rate from 14.5% in the 2nd quarter of 1999 to 13.3% in the final quarter of the year. This is the lowest quarterly rate since the 3rd quarter of 1990. As can be seen from Chart 2, youth labour market conditions improved in all regions of the country in the latter half of 1999. The seasonally-adjusted youth unemployment rate in Atlantic Canada declined by almost 1.3 percentage points between the 2nd and 4th quarters of last year, falling from 19.4% to 18.1%. The jobless rate among youths in Central Canada experienced the largest decline during this period, dropping from 14.8% to 13.1%. The decline in Western Canada’s youth unemployment rate was negligible compared to that elsewhere in the country, falling from 12.8% in the 2nd quarter to 12.7% in the 4th quarter of 1999. For the second consecutive year, Manitoba registered the lowest annual youth unemployment rate (10.1%) in 1999. Full utilization of Canada’s manpower resources has been a long-standing policy objective of the government. However, a specific policy geared toward youth in the labour market has never been explicitly stated. Unless associated with the Standing Committee on Human Resources Development, most Members of Parliament seldom find themselves dealing with subject matter specifically related to youth in the labour market. On 11 December 1984, a unique opportunity was provided to 12 Senators when a Special Committee was established to study the issues and problems facing young Canadians. In its final Report, the Special Committee made a number of recommendations, including the need for measures to reduce illiteracy among youth, increase co-operative education and apprenticeship training and establish a Young Canadians’ Community Service Program. Most recently, Bill C-12 (An Act respecting employment insurance in Canada) was examined by Parliament and received Royal Assent on 20 June 1996. Among other changes, the entrance requirement for new labour force entrants, many of whom are young workers, was significantly increased. This, and a host of other cost-saving measures, will increase the amount of funds available for training and job creation, collectively called employment benefits.
19 February 1986 - Report of the Special Senate Committee on Youth - Youth: A Plan of Action - was tabled in the Senate. 3 December 1986 - The Minister of Employment and Immigration tabled the Report of the Commission of Inquiry on Unemployment Insurance (Forget Commission). In addition to recommendations on unemployment insurance reform, the Report contained a number of recommendations which focused on human resource development. Two of these were directed specifically at youth. The need to cooperate with provincial governments to ensure that all youth could achieve a high minimum level of education was mentioned. It was also suggested that the Minister of State for Youth should consider implementing a comprehensive Youth Opportunities Program. 1 December 1987 - Youth would undoubtedly benefit from some of the recommendations in the recent report of the Senate Sub-committee on Training and Employment (In Training, Only Work Works), particularly in terms of the need to address the problem of illiteracy and develop more comprehensive education and training programs involving links between school and industry. 12 January 1988 - The Minister of State for Youth announced that the government would allocate $180 million to the Challenge ‘88 program. Roughly 70% ($127 million) of this would be spent on the Summer Employment/Experience Development component of the program. 27 January 1989 - The Minister of State for Youth announced that the government intended to spend $198.9 million on Challenge ‘89. The largest component of this program - Summer Employment/Experience Development - would receive $119 million. 11 April 1989 - The Minister of Employment and Immigration announced the details of the government’s Labour Force Development Strategy. Although the bulk of this strategy focused on reforming the Unemployment Insurance Program, there was a measure to increase expenditures on entry-level skills development by $100 million in the coming fiscal year. Most of this would be earmarked for apprenticeship training and co-operative education. 9 February 1990 - The Minister of Employment and Immigration announced funding for Challenge ‘90 ($125.9 million) and a $296-million five-year program called the National Stay-in-School Initiative. Some $47 million was to be expended on this initiative in 1990-91. 23 October 1990 - Bill C-21 received Royal Assent thus paving the way for the government to implement its Labour Force Development Strategy. Part of this strategy called for additional spending ($100 million) on entry-level training. 4 February 1991 - The Minister of State for Youth, Fitness and Amateur Sport announced $143 million would be allocated to the 1991 Challenge Program. The Summer Employment/Experience Development Program would receive $80 million, Work Orientation Workshops would receive $35.2 million, Student Business Loans $942,000, Business Drive for Jobs $805,000, and Native Internship $2.3 million; $9.7 million would be allocated to Canada Employment Centres for Students, and the remainder to program delivery costs. 29 October 1991 - The Ministers of Industry, Science and Technology and of Employment and Immigration announced the Prosperity Initiative, a comprehensive consultation process designed to establish initiatives to enhance Canada’s international competitiveness. One of the major aspects of this initiative involved human resource development. As education and training determine, in part, the productive capacity and earning potential of the labour force, these consultations were important for Canada’s youth, especially those who failed to obtain a basic education. 18 March 1992 - The Minister of State for Youth, Fitness and Amateur Sport announced that $96.7 million would be allocated to the 1992 Challenge Program. While this was considerably less than the previous year’s allocation, it should be noted that WOW (Work Orientation Workshops) was no longer an option under the Challenge Program. As of 1992-93, these expenditures would be incorporated with the START option under the Stay-in-School initiative. Approximately $53.7 million would be available under START in 1992-93. 29 October 1992 - The Steering Group on Prosperity released its report Inventing Our Future: An Action Plan for Canada’s Prosperity. The report outlined a number of ways for ensuring that young people were better prepared to enter the world of work. 24 February 1993 - The Minister of State for Youth, Fitness and Amateur Sport announced that $101.9 million would be allocated to the 1993 Challenge Program. The breakdown was as follows: Summer Employment/Experience Development, $88 million; Student Business Loans, $1.14 million; Business Drive for Jobs, $0.8 million; Canada Employment Centres for Students, $9.6 million; and Native Internship, $2.4 million. 18 January 1994 - In the Speech from the Throne, the government announced its intention to create a Youth Service Corps to put young people back to work as well as develop, in partnership with the provinces and the private sector, initiatives to better prepare youth for the transition from school to work. 15 April 1994 - The government announced the basis of a youth employment and learning strategy. This strategy comprises six initiatives: Youth Service Canada, Youth Internship, Summer Employment Program, a reformed Canada Student Loans Program, Learning Initiatives and Stay-in-School. The strategy is budgeted at $684.5 million in 1994-95; almost 70% is earmarked for student loans. 23 June 1994 - The Canada Student Financial Assistance Act received Royal Assent thus paving the way for an increase in loan limits as well as other reforms. In the beginning of August, full-time weekly loan limits increased from $105 to $165 and the ceiling on loans to part-time students increased from $2,500 to $4,000. 17 March 1995 - The Secretary of State (Training and Youth) announced that $90.1 million would be spent on the Student Summer Job Action Program in 1995, to create 44,500 summer jobs for secondary and post-secondary students. 6 March 1996 - As part of the budget, the Minister of Finance announced that the government intends to spend an additional $165 million over a three-year period to encourage education and skills development among youth. In addition, $350 million will be reallocated over the same period to promote employment opportunities among youth. Some of these funds will be used to double spending on summer job placements in 1996-97. 20 June 1996 - Bill C-12 (An Act respecting employment insurance in Canada) received Royal Assent and thereby replaced the Unemployment Insurance Act. 1 July 1996 - The Minimum Hourly Wage Order, 1996 came into effect. As a result of this change, the federal minimum wage is now aligned with the general minimum wage rate in each province and territory. As of 1 July 1996, the federal minimum hourly wage increased from $4.00 to a low of $4.75 in Newfoundland and a high of $7.00 in British Columbia. 8 September 1997 - The government committed $90 million (over three years) to provide one-year internships in the federal public service for unemployed youths aged 15 to 30. 23 September 1997 - In the Speech from the Throne, the government promised to work in several ways to assist youths in making a smoother transition from school to work. These ways include providing financial support for post-secondary studies; extending and broadening internship programs; developing a nation-wide mentorship program; and expanding community-based employment programs for disadvantaged youths. 19 February 1998 - The government announced that it intends to spend $120 million on Student Summer Job Action this year. This funding is expected to provide jobs to some 60,000 students. 24 February 1998 - The Minister of Finance tabled a budget containing several youth-related measures. These included the creation of a scholarships fund; a 17% tax credit on federal/provincial student loan interest payments; improvements to the Canada Student Loans Program, such as interest relief; the introduction of an education savings grant; an EI premium holiday for employers who hire youths in 1999 and 2000; and increased funding to create job opportunities for youths who lack basic education and job skills, the most disadvantaged of all unemployed youths. The federal government intends to double resources devoted to members of this group, especially those 20-24 years of age who have not completed high school. 7 December 1998 – The government announced that, commencing in the fiscal year 1999-00, permanent funding of $155 million per year would be allocated to the Youth Employment Strategy. This allocation is almost 50% higher than yearly expenditures devoted to this initiative during the first three years of operation. Funding for the strategy had been set to end on 31 March 1999. 8 February 1999 – The government announced that it intends to devote $120 million to Student Summer Job Action in 1999. It is hoped that these funds will help create summer jobs for more than 60,000 students. Last summer, this threshold was exceeded by 10,000 students. 27 January 2000 – The Minister of Human Resources Development announced that the federal government expects to spend $120 million on the Student Summer Job Action program in 2000. This amount is unchanged from last year’s allocation and is projected to provide over 60,000 summer jobs for students across the country. Betcherman, G. and R. Morissette. Recent Youth Labour Market Experiences in Canada. Research Paper Series No. 63, Statistics Canada, July 1994. Canada, Ministerial Task Force on Youth. Take on the Future: Canadian Youth in the World of Work. 1996. Crompton, S. "Employment Prospects for High School Graduates." Perspectives, Statistics Canada, Autumn 1995. Denton, F.T., A.L. Robb and B.G. Spencer. Unemployment and the Labour Force Behaviour of Young People: Evidence from Canada and Ontario. Ontario Economic Council, University of Toronto Press, 1980. Statistics Canada, "Youths and the Labour Market." Labour Force Update. Spring 1997. Sunter, D. "Youths - Waiting it Out." Perspectives, Statistics Canada, Spring 1994.
UNADJUSTED YOUTH UNEMPLOYMENT
RATES BY AGE
Revised data based on the new method of estimation and population counts based on the 1996 Census. Source: Labour Force Survey, Statistics Canada.
UNADJUSTED YOUTH
UNEMPLOYMENT RATES
Revised data based on the new method of estimation and population counts based on the 1996 Census. Source: Labour Force Survey, Statistics Canada. * The original version of this Current Issue Review was published in January 1982; the paper has been regularly updated since that time. |
||||||||||||||||||||||||||||||||||||||||||||||||||||||