PRB 01-5E
THREE DECADES OF
ECONOMIC AND FINANCIAL CHANGE
Prepared by: TABLE OF CONTENTS EMPLOYMENT, COMPENSATION AND EMPLOYMENT INCOME THE LABOUR MARKET AND PRODUCTIVITY A. Structural Changes in the Labour Market HOUSEHOLD CONSUMPTION AND SAVING A. Personal Spending and Consumer Credit THE FINANCIAL HEALTH OF GOVERNMENTS IN CANADA B. Inflation, Public Debt and Context Unfavourable to Investment FIGURES Figure 1 – Growth in the Canadian Economy, 1969 to 1999, Figure 2 – Real per capita GDP Figure 3 – Average Unemployment Rate per Decade as a Percentage of the Labour Force Figure 4 – Average Annual Participation Rate Figure 5 – Average Hourly Employment Income, 1992 Dollars Figure 6 – Direct Taxes (With and Without Benefits) as a Percentage of Personal Income Figure 7 – Per capita Real Disposable Personal Income Figure 8 – Number of Computers per 1,000 People Figure 9 – Changes in Productivity as Measured by GDP Figure 10 – Consumer Credit as a Percentage of Disposable Income Figure 11 – Savings Rate as a Percentage of Disposable Personal Income Figure 12 – Domestic Savings as a Percentage of GDP Figure 13 – Negative Value of Net Financial Assets Figure 14 – Interest on Government Debt in Canada as a Percentage of GDP Figure 15 – Tax Revenue of Governments in Canada as a Percentage of GDP Figure 16 – Average Annual Inflation Rate Based on the Consumer Price Index (CPI) Figure 17 – Average Annual Return on Federal Government Securities Figure 18 – Gross Fixed Capital and Stock Formation as a Percentage of GDP TABLES Table 1: Percentage Growth in Real GDP in Canada, 1969 to 1999 Table 2: Changes in Time Spent on Paid Work by Canadian Families Table 3: Percentage Growth in Total Hours Worked and Population in Canada Table 4: Percentage Growth in Total Hours Worked in Canada by Major Sector Table 5: Percentage Growth in Productivity in Canada Table 6: Percentage Growth in Real GDP per Hour Worked Table 7: Percentage Real Growth in Consumer Spending, THREE DECADES OF ECONOMIC AND FINANCIAL
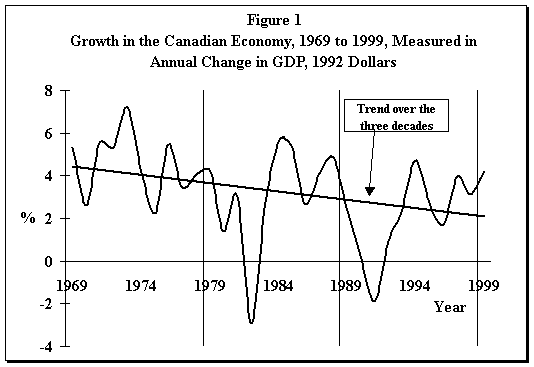
CHANGE In a speech to the Sainte-Foy regional chamber of commerce in April 2000, the Governor of the Bank of Canada, Gordon Thiessen, noted how important it became in the early 1990s to resolve “the problems that had been hampering [Canada’s] economic performance through most of the 1970s and 1980s.”(1) A simple review of changes in some of the key variables in the Canadian economy over the past three decades sheds more light on Mr. Thiessen’s comments. Through those 30 years, the structure of the Canadian economy was completely transformed. Many of the changes stimulated economic activity, but the dramatic decline in the financial health of governments – federal and provincial alike – had the opposite effect, gradually eroding the country’s economic well-being. The Canadian economy has improved dramatically in the past few years, as has the financial situation of governments. Moreover, the current economic status of Canadian households, against a backdrop of sustained economic growth and low inflation, augurs well for the years ahead. In a nutshell, the current situation is very different from the financial doldrums of the past 20 years. This document briefly analyzes changes in the Canadian economy over the three decades from 1969 to 1999. The main variables are national output, income, the labour market, productivity, consumer spending, savings, the financial situation of governments, and investment in general. The close link between standard of living and productivity demands a more comprehensive examination of investment as a whole.(2) Figure 1 shows changes in national output, measured by variation in real Gross Domestic Product (GDP) (data adjusted for inflation), between 1969 and 1999.
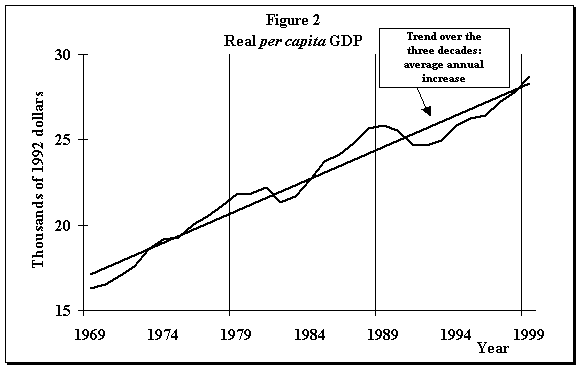
Source: Statistics Canada Only the first of the three decades studied here (1969-1979) did not experience a major recession.(3) The other two each had one recession – the first in 1982, the second in 1991 – neither of which augured well.(4) In order to take population growth into account, the real GDP is divided by the total population to obtain real per capita GDP. That measurement is often associated with general changes in standard of living (Figure 2).
Source: Statistics Canada The straight line through the curve in Figure 2 represents the trend observed over the three decades. The sharp drop in the early 1990s was followed by a slow recovery; the GDP did not rebound to the level indicated by the trend until 1999. Figure 2 shows that economic growth in the early 1990s was far too low to sustain Canadians’ standard of living. Table 1 below completes the overall picture painted in the first two figures by summarizing performance for each of the three decades and the entire period. Table 1: Percentage Growth in Real GDP in Canada, 1969 to 1999
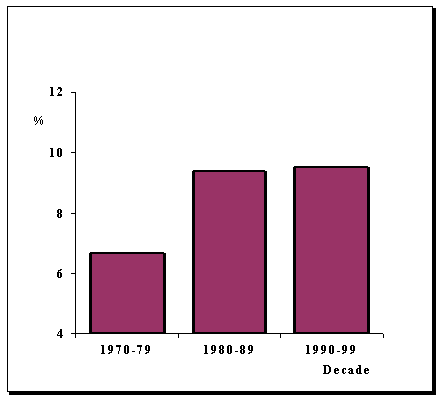
Source: Statistics Canada Over the entire period, the real value of goods and services produced in Canada increased 155%, which on the whole is remarkable. However, economic growth decreased with time, from just over 54% in the first decade to 33% in the second and only 24% in the third. The two right-hand columns in Table 1 show real per capita GDP, which grew at an even slower pace. Between 1989 and 1999, that indicator of standard of living was rather stagnant, increasing only 1% a year on average, barely half the rate of the previous decade and only a third of the average rate in the 1970s.(5) The data in Table 1 and Figures 1 and 2 clearly show that the Canadian economy had trouble rebounding from the recession in the early 1990s, which contributed to slower growth in the Canadian standard of living. EMPLOYMENT, COMPENSATION AND EMPLOYMENT INCOMEThis section focuses on changes in employment and employment income between 1969 and 1999. Because workers’ wages and benefits are generally considered to be the main component of the GDP, this examination will provide a better understanding of the causes of the economic slowdown and its impact on workers’ standard of living. Employment has changed significantly over the past three decades, but the changes lagged somewhat behind changes in overall economic conditions. Although the unemployment rate is an imperfect indicator because it does not provide complete information on factors affecting the labour market over time, the rate showed a definite upward trend between 1969 and 1999 (Figure 3). Figure 3
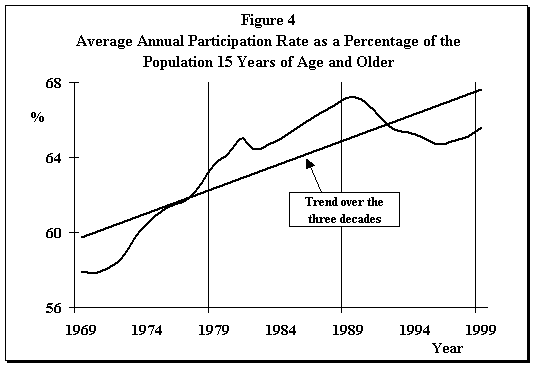
Source: Statistics Canada The average annual unemployment rate increased from just over 4% in 1969 to more than 7% in 1999. Twice, during the recessions that occurred at the beginning of the past two decades, the unemployment rate rose to just over 11%. This mediocre overall performance in employment over 30 years is attributable in part to an increase in the number of labour market participants. Although young people have tended to stay in school longer than they once did, participation by spouses – especially women – has increased considerably. This situation is clearly reflected in the changes in the participation rate (Figure 4).
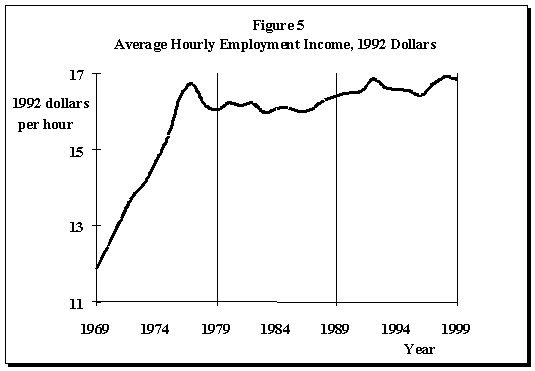
Source: Statistics Canada Unemployment – the downside of employment – increased, a sign that more human resources are being unused over a long period and that production levels are below the capacity of workers as a whole. This general observation is followed by a look at other variables related to the labour market, starting with a consideration of how workers’ average compensation changed over the past three decades. The data from Statistics Canada show that average employment income in 1992 dollars was almost unchanged between 1979 and 1999, rising from $16.04 an hour in 1979 to $16.84 in 1999. Actual wages have not increased since 1976 and never exceeded $17 an hour in 1992 dollars (Figure 5).
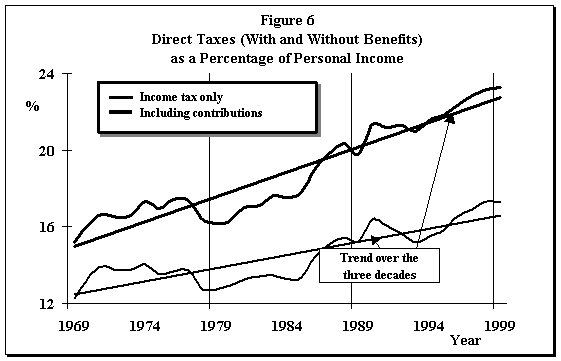
Source: Statistics Canada The average annual increase in the output of the Canadian economy was 2.6% between 1979 and 1999, but that growth was not accompanied by a similar increase in workers’ average real wages. The circumstances surrounding that phenomenon and the restrictive fiscal policies applied in the 1990s – which resulted in heavier tax burdens – account for the popular perception that the standard of living has declined in Canada. Figure 6 shows the growing percentage of direct taxes taken out of Canadians’ personal income. Between 1969 and 1999, the proportion of personal income paid in direct taxes increased from 12% to 17% – or from 15% to 23% if contributions to benefit programs such as employment insurance (formerly unemployment insurance) are included.
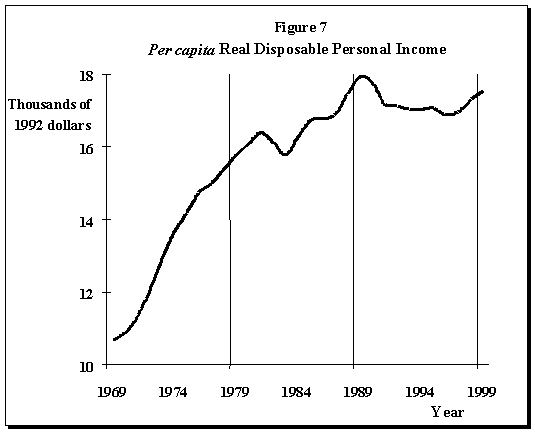
Source: Statistics Canada In short, the weak growth in wages and the increase in taxes resulted in a poor performance in real per capita disposable (after-tax) personal income. Over the past three decades, per capita annual after-tax income, adjusted for inflation, never exceeded $18,000 in 1992 dollars. The slowdown in growth in per capita disposable income began in the late 1970s, and the 1981-1982 recession – considered to the worst economic downturn since the Crash in the 1930s – caused the performance of that variable to plummet. The benefits of the subsequent recovery, which peaked in 1989, were simply erased in the 1990s. Despite a slight rebound since 1997, real per capita disposable income in 1999 was still below the peak reached ten years earlier and would have been lower still but for transfer payments to households, such as employment/unemployment insurance benefits (Figure 7).
Source: Statistics Canada THE LABOUR MARKET AND PRODUCTIVITY Although the increase in taxes and the stagnation of wages and employment have weakened Canada’s economic health, other factors have had the opposite effect, such as structural changes in the labour market and technology and the demand for consumer goods. Those other factors are discussed in this and the following sections. A. Structural Changes in the Labour Market There was a time when, in most households, only the head of the family was employed full time; the spouse did unpaid work caring for the family. The organization of work in Canadian households has changed dramatically since the 1960s. The time spent doing paid work increased in Canadian households – especially during the 1960s, 1970s and 1980s. Table 2 summarizes the changes between 1971 and 1994, a period which captures the essence of the past three decades and in which the time spent by families on paid work increased an average of 20%. Family heads (especially men) perhaps decreased slightly the average time they spend in the labour market, but their spouses – especially women – more than doubled the time they spend on paid work. Table 2: Changes in Time Spent on Paid Work by Canadian Families
* Families that reported no work time and single-parent families are not included in the sample used to calculate these averages. Source: Statistics Canada, Survey of Consumer Finances, 1971, 1994 On the other hand, a review of the data on individual workers in Canada does not show any increase in average hours of work, but rather a slight decrease.(6) These statistics can be misleading, because Canadian households have significantly increased the amount of time they spend doing paid work. Table 3 shows growth – 63.4% – in the total number of hours worked annually by all Canadians between 1969 and 1999. Between 1979 and 1999, growth was 34.1%. That scale of growth undoubtedly played a key role in the increase in national output and therefore the increase in real GDP (see Table 1). Interestingly, growth between 1989 and 1999 – 10.4% – was less than half the rate in the preceding period – 21.5% – even though the population increased almost 12%. Consequently, the rate of growth in employment was far lower than the rate of growth in the general population over the past decade. The almost complete lack of progress in the per capita real GDP for the period explains the very poor performance of employment, which increased less quickly than did the population. This observation meshes with the numbers on unemployment and participation rate. Between 1989 and 1999, output per hour worked increased nevertheless by 10%, an outstanding performance without which the per capita GDP would obviously have decreased. Table 3: Percentage Growth in Total Hours Worked and Population in Canada
Source: Statistics Canada The slow economic development in recent years compared with earlier periods is attributable to the time it took the economy to recover from the recession of the early 1990s. This may be linked to: the many job cuts in the public sector over that period; population aging; or simply a decrease in the supply of new jobs in the private sector. It is also possible that the labour force grew too quickly – taking the prevailing conditions into account – in the earlier periods, when households decided to spend more time on paid work, thereby creating a surplus of available workers. It should be noted that service-producing industries accounted for most of the job creation (Table 4): the number of hours worked in the goods sector increased only slightly, whereas in the services sector, the number doubled in almost 30 years (the latest data are for 1996). Further, employment in the goods sector was hit hard by the recession in the early 1990s, whereas services – including all public administration and government services – performed fairly well. Table 4: Percentage Growth in Total Hours Worked in Canada by Major Sector
Source: Statistics Canada The new predominance of service-producing or tertiary industries is a major characteristic of economic growth in recent decades. The burgeoning service-based economy in Canada reflects the changing relationship between material and non-material methods of producing and destroying value, or the shift from an industrial economy to a knowledge-based economy. These changes contribute to what economists call “structural changes,” i.e., fundamental changes in production processes caused by technological advances and changes in the labour force and skills. This has led to some corporate restructuring, a process fostered to some degree by the deregulation of key industries that began in the 1980s and increased in the 1990s, as noted by the latest survey from the Research Division of the Bank of Canada.(7) All this upheaval should have a direct bearing on productivity. “Productivity” is usually a measurement of the effectiveness of production factors – such as the labour force, capital and, more recently, technology – in producing goods and services in an economy. Labour force training and education, the accumulation of capital, and the ability to absorb new technologies are other factors which help increase productivity; Canada fared well in these areas between 1969 and 1999. Most Canadian businesses – knowledge-based businesses, at least – have made new information and communications technologies a central part of their production. Many businesses have also contributed to the technological explosion that has taken place in recent years. Canada is a world leader in the use of new technologies, as witnessed by statistics on per capita use of computers, which show that Canada ranks among the top five countries year after year (Figure 8).
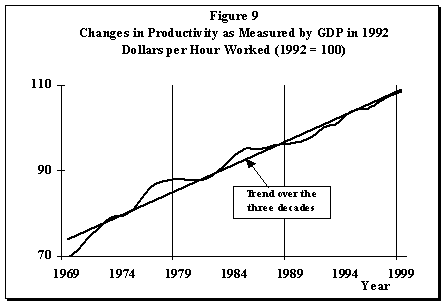
Source: Computer Industry Almanac, Inc. A special study carried out by Statistics Canada in 1999(8) showed that growth in productivity in Canada was similar to growth in the United States over the previous 40 years. (That relatively good performance cannot hide the fact, however, that Canada does not fare as well in some areas related to high technology, such as spending on communications equipment.(9)) In contrast, the May 2000 Bank of Canada report on monetary policy stated that Canada’s performance in terms of productivity was lacklustre compared to the United States in the 1990s.(10) Yet monetary authorities are cautiously optimistic about overall conditions for increased productivity in the years ahead. Changes in real GDP per hour worked – commonly referred to as “labour productivity” – is one indicator used to measure the competitiveness of the economy (Figure 9). However, it also reflects changes in other production factors, such as the quantity and quality of capital.
Source: Statistics Canada Despite a recent slowdown compared with the trend for the period, output per hour worked rose more than 50% between 1969 and 1999 (Table 5), a sign of a somewhat sustained increase in labour productivity in Canada. This is an astonishing performance given how fast structural change took place in the economy over those years. Table 5: Percentage Growth in Productivity in Canada
* Multifactor productivity measures the portion of growth in real GDP that exceeds the total of growth in labour and capital. It therefore covers indirect effects such as the impact of education and technology. Source: Statistics Canada The second heading in the table is growth in “multifactor” productivity, another measurement used by Statistics Canada. Multifactor productivity is that part of the growth in output attributable not to labour, capital or other intermediate inputs, but rather such factors as technology, organizational change in businesses, and human capital. Once again, Canada did well, recording growth of 11.4% from 1977 to 1997 and 35.6% from 1967 to 1997. In Table 6, labour productivity is calculated for the business sector only, which allows comparison between Canadian and U.S. performance. Table 6: Percentage Growth in Real GDP
Sources: 2000 Economic Report of the President (United States) and Statistics Canada (Canada) This analysis seems somewhat less favourable for Canada and is in line with the Bank of Canada’s observation that productivity increased at a slower rate in Canada than in the United States. The table shows that output per hour worked increased almost 60% in Canada between 1969 and 1999 but was still 15 percentage points below growth in the United States. Between 1979 and 1999, the gap was almost 20 points. It should be noted, however, that the difference stems primarily from the fact that the United States adopted a new method of calculating the GDP in 2000. Consequently, some observers contend that it is not really possible to compare growth in productivity in Canada and the United States. Some even believe that if the methods used by the two countries to calculate GDP were more alike, growth in productivity would have been almost the same in Canada and the United States between 1969 and 1999. Statistics on productivity in Canada therefore cut both ways: the Canadian economy has certainly benefited from new technologies and freer world trade, but it has probably also shown some weaknesses relative to the U.S. economy, especially in the past decade. HOUSEHOLD CONSUMPTION AND SAVING A. Personal Spending and Consumer Credit A household’s after-tax income must be either spent or saved. Consumer spending, i.e., spending by households on goods and services, is the main component of domestic demand. The other two components are: spending by businesses on equipment, tools and furniture; and government spending. The sustained growth in domestic demand for goods and services has probably stimulated economic growth in recent years. Table 7 shows growth in per capita consumer spending (the numbers are adjusted for inflation). Table 7: Percentage Real Growth in Consumer
Spending,
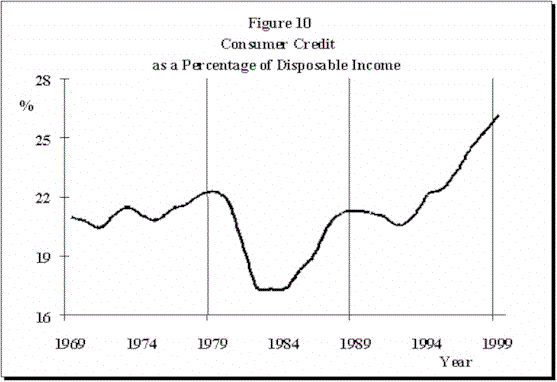
Source: Statistics Canada Average real per capita spending increased 78% between 1969 and 1999, but only 10% between 1989 and 1999. The decline in real per capita disposable income was shown in Figure 7. Table 7 also shows that per capita disposable income adjusted for inflation increased by only just over 11% between 1979 and 1989 and even decreased in the following ten years. What accounts for this fairly significant increase in household consumption when income did not increase much? One explanation lies in consumer credit, which recorded average real per capita increases of 105% between 1969 and 1999, 31% between 1979 and 1999, and 20% between 1989 and 1999. The increase in consumer spending therefore offset the lack of disposable income, particularly in the 1990s. This means that consumer credit is up relative to disposable income (Figure 10). Consumer credit for individuals and businesses now represents more than 26% of disposable income, the highest level since Statistics Canada began producing that type of data in 1967. The fact that the increased debt load comes on top of the absence of change in disposable income certainly has an impact on household saving, as discussed in the next section.
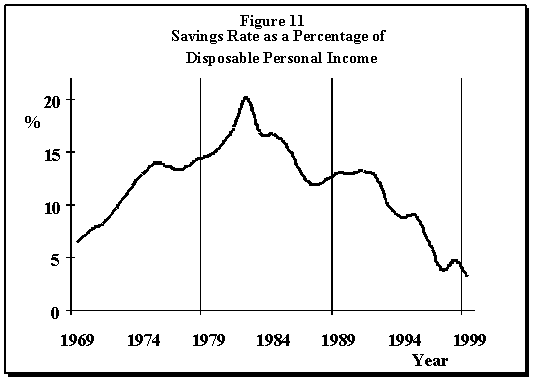
Source: Statistics Canada Another reason for the increase in consumer spending may be the organization of work in households. Many goods and services can be procured in the marketplace or produced at home. For example, child care, home maintenance (housecleaning, yard work, repairs, etc.), meal preparation, clothing, and financial services are goods and services that can be purchased in the marketplace or provided at home. Because Canadians have considerably increased the number of hours they spend working in the labour force, their income is higher and they have less time to spend on domestic tasks. Owing to the lack of time, some of the things that used to be done or made at home is now purchased. A 1999 study showed that the more people worked outside the home and the more money they earned, the higher the proportion of their income they spent.(11) Over the past 30 years, individual saving increased, peaking in 1982 at more than 20% of after-tax personal income, and then dropped steadily to about 3%, according to Statistics Canada data revised in 2000 (Figure 11).(12) The decline in saving is probably due in part to the decrease in disposable personal income. However, the peak reached in 1992 also coincided with high inflation rates. This may be further evidence of the adverse effect of inflation on spending and saving decisions, given the growing uncertainty about future income.(13)
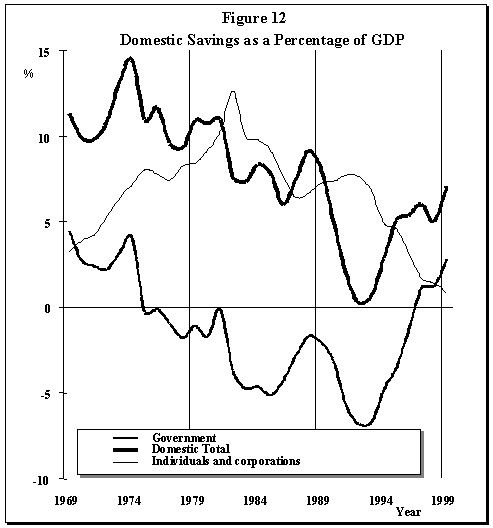
Source: Statistics Canada Total domestic savings cover not only individuals, but also corporations and governments. Total domestic savings – which do not include the savings of non-residents – increased substantially in the second half of the 1990s (Figure 12 – in the interest of readability, savings attributable to companies are not shown).
Source: Statistics Canada Measured as a percentage of GDP, domestic savings were above 7%, close to the levels reached in the early 1990s. Although individuals were unable to increase their savings for more than 15 years, governments, in contrast, improved their financial situation dramatically. At the end of the 1990s, governments had a budget surplus for the first time in almost 30 years. It is interesting to compare the saving habits of governments and individuals. Starting in the early 1970s, saving by the public decreased, at a time when governments were beginning to carry deficits but individual saving was increasing considerably. A recession in the early 1980s plunged governments farther into debt and slowed growth in the individual savings rate. Individual saving then peaked and began a steady decline. Governments continued to run up deficits until the recession in the early 1990s made matters far worse, and the federal and provincial governments decided to do what they had to do to stop the erosion of public funds. Stringent budget policies brought about a remarkable change. That change coincided with an increase in the rate of decline in personal saving. In a sense, personal saving and public saving offset each other. Ultimately, the decline in personal saving in the 1990s must be viewed in light of the sizeable increase in total domestic saving over the same period, and the only real explanation for that increase is the better financial health of governments in Canada. THE FINANCIAL HEALTH OF GOVERNMENTS IN CANADA The mounting debt of governments in Canada is the result of deficits accumulated over almost the entire three decades. The magnitude of the combined debt of the three levels of government is clearly illustrated by changes in the negative value of their net financial assets (therefore their net liabilities) relative to the GDP (Figure 13). The advantage of the notion of “net financial assets” is that it is relatively easy to interpret. To fund their activities, governments issue securities that make up the bulk of the financial debt. That debt – or liability – far outstrips the value of the governments’ securities and cash – or assets; hence the negative value. New securities, mainly negotiable bonds, have been issued at a much faster pace than old issues have matured; this has significantly increased the negative value of net financial assets, particularly for the federal government.
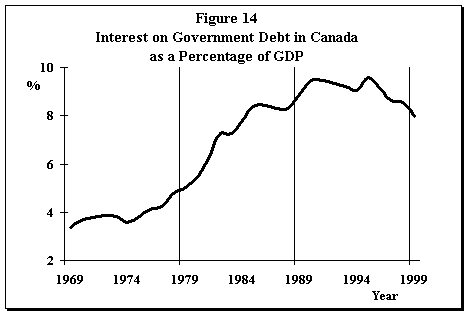
Source: Statistics Canada The net financial assets of the three levels of governments represented 24.4% of the GDP in 1969. In 1995, the ratio peaked at just over 95%, a level not seen since the period immediately after World War II, when the war effort justified a massive federal government loan. Since then, the strong improvement in the budget situation of the federal and provincial governments – in a context of sustained economic growth – has brought the ratio down to approximately 81%. Despite that drop of almost 14 percentage points, the ratio is still very high, both historically and in relation to the ratios in other G7 countries. The growing government debt increased the amount of interest paid on outstanding securities, which accounted for most of the interest on the combined public debt of all governments in Canada. The ratio between interest and the GDP rose steadily (Figure 14). Figure 14 shows how much governments were shackled by interest on the debt. Interest on the public debt was barely more than 3% of the GDP in the 1970s but was almost 10% of the GDP in 1995. As stated earlier, the best economic performance in recent years and the return by most governments to a balanced budget helped ease the burden, bringing it down to 8% of the GDP in 1999.
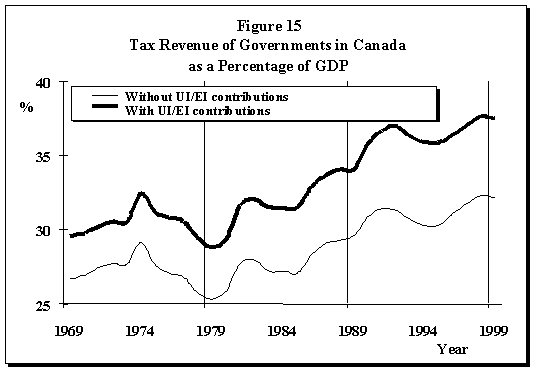
Source: Statistics Canada To improve their financial situation, governments cut spending and increased taxes, which brought them more revenue. Tax revenue thus represented a steadily increasing share of the GDP (Figure 15). The proportion was only 26% in 1969, not taking into account contributions to the unemployment/employment insurance plan. Thirty years later, it was more than 32% (37%, if contributions are included). These numbers are consistent with those shown in Figure 6 and confirm the impression among Canadians that an increasing portion of their income is finding its way into government coffers.
Source: Statistics Canada B. Inflation, Public Debt and Conditions Unfavourable to Investment At the very time the financial situation of governments started to seriously deteriorate in the 1970s, the Canadian economy was grappling with high inflation. As Figure 16 shows, inflation – measured by the annual change in the Consumer Price Index (CPI) – reached its highest levels in the early 1980s. However, it was not until the mid-1990s that growth in overall prices was considered to be under control. The damage caused by high inflation in the 1970s and 1980s is summed up in the following statement: “Businesses and individuals end up spending more time and money either protecting themselves against inflation or trying to benefit from it.”(14)
Source: Statistics Canada Inflation is a serious problem, particularly because of the adverse effect it has on long-term decisions related to saving – as discussed earlier – or corporate investment:
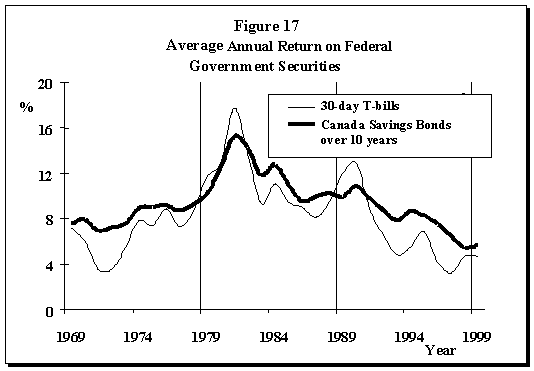
An even more important factor is that uncertainty about future inflation and projected high inflation rates create upward pressure on nominal interest rates, which is bad for investment. The negotiable securities already issued by the federal government to pay off its growing debt became less attractive to institutional vendors, which pushed up their return or kept it high (Figure 17). Again, the result was higher interest rates. In other words, the increase in public debt and high inflation resulted in much lower borrowing costs for capital projects, which in turn discouraged productive investment, corporate investment in particular.
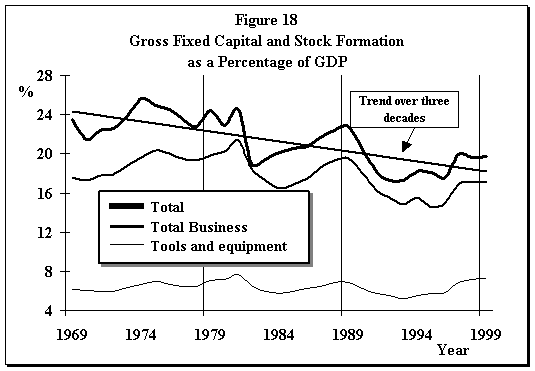
Source: Bank of Canada The unfavourable investment climate created by inflation and the subsequent deep budget cuts – which led to a decrease in spending on goods, equipment and infrastructure in the public sector – led to a drop in investment in Canada between 1969 and 1999. Figure 18 shows the decline in investment or “gross fixed capital formation,” i.e., spending which increases capital stock or fixed assets like equipment, as a percentage of the GDP.
Source: Statistics Canada Public and private investment in Canada relative to the GDP was approximately 24% in the 1970s but never climbed above 20% between 1989 and 1999. Moreover, the sharp drop in public investment during the recession in the early 1980s never really offset the subsequent rebound in private investment, which was not affected by the recession in the early 1990s. In fact, the ratio of private investment dropped even lower in the 1990s and – even with the recovery of private investment that began in earnest in 1997 – was still 17.2% of the GDP in 1999, below the 19.5% reached in 1989. The fact that investment is not increasing – in fact, barely keeping pace with the normal wear and tear on infrastructures, facilities, equipment and tools(15) – creates an atmosphere that is not very conducive to productivity, yet is an essential requirement for sustained economic growth. This unfavourable situation, coupled with the enormous fiscal pressure needed to resolve the budget deficit, accounts in part for the lower performance – compared to the United States – of the Canadian economy and Canadian productivity in the 1990s. CONCLUSIONThe period from 1969 to 1999 was dominated by declining economic performance and poor financial health, particularly in the public sector. This poor overall performance translated over the long term into a decline in Canadians’ standard of living and productivity. However, value-creating mechanisms underwent major structural changes, in particular the transition from an industrial economy to a knowledge-based economy. The period was also marked by a significant increase in the time families spend working in the labour force. The adjustments made to the structure of the Canadian economy in order to deal with global competition and improve the financial situation of governments brought a happier end to the 1990s, which had got off to a very bad start because of the problems that had accumulated over the previous 20 years. John McCallum described the 1990s as a decadis horribilis,(16) but the high note on which the decade ended certainly suggests good things ahead for the Canadian economy. The task now is to determine whether governments will continue to perform well financially despite such factors as mounting pressure on health care costs as a result of population aging.(17) The effect of that pressure and the path productivity takes in the next decade will determine whether the current optimism is warranted. (1) Gordon Thiessen, “The Canadian Economy: Charting a Course for the Future,” speech to the regional chamber of commerce in Sainte-Foy, Quebec, 26 April 2000. (2) The data used in this study are primarily from the National Income and Expenditure Accounts and the National Balance Sheet Accounts, both of which are published by Statistics Canada. Other sources of data include such Statistics Canada publications as the Consumer Price Index and the Labour Force Survey and Bank of Canada financial statistics. (3) Real growth in the GDP was negative in the first two quarters of 1979, but positive growth in the other two quarters resulted in positive growth for the year overall. (4) In their quarterly forecasts, senior economists at the TD Bank were among a fairly large contingent who pointed out this coincidence. See the 22 June 2000, TD Quarterly Economic Forecast (http://www.tdbank.ca/tdeconomics/economic_forecasts/forecasts/qefju00.pdf). (5) In Scotiabank’s quarterly economic bulletin, senior economist Adrienne Warren made this same observation but added that the performance of the per capita GDP over the past decade has barely been a quarter of the performance recorded in the 1960s. See Canadian Quarterly, 6 July 2000. (6) For example, the average work week for a typical Canadian worker decreased from 39 to 37.4 hours between 1976 and 1998. (7) Article in
the Summer 2000 issue of Bank of Canada Review; a summary is posted at: (8) J. Baldwin, J.-P. Maynard and J.S. Wells, “Productivity Growth in Canada and the United States,” Canadian Economic Observer, Statistics Canada, Ottawa: September 1999. (9) Canada’s strengths and weaknesses relative to the United States regarding current high technology are summarized in “Challenges of Rapid Technological Change: Catching up with the Jetsons,” a special issue of Micro-Economic Monitor, published by the Micro-Economic Policy Analysis Branch of Industry Canada (http://strategis.ic.gc.ca/SSI/ra/sp99q4_e.pdf). (10) See
technical note 2 on page 25 (11) Marianne Baxter and Urban J. Jermin, “Household Production and the Excess Sensitivity of Consumption to Current Income,” The American Economic Review, September 1999, pp. 903-920. (12) Before that revision, the savings rate for 1999 was 1.4%. (13) One of
several plausible explanations for the relationship between household spending and
inflation, reported in Bank of Canada discussion paper 2000-3, entitled “Long-Term
Determinants of the Personal Savings Rate: Literature Review and Some Empirical
Results for Canada,” by Gilles Bérubé and Denise Côté, February 2000. (14) Gordon Thiessen, Governor of the Bank of Canada, “The Canadian Economy: Finding the Right Balance,” speech to the Kelowna Chamber of Commerce, Kelowna, British Columbia, 15 June 2000. (15) Or “depreciation,” roughly measured by amortization. (16) The Royal
Bank’s chief economist was playing on a statement by Her Majesty the Queen when he
commented on the drop in real per capita disposal income (“Will Canada matter
in 2020?” Current Analysis Reports (Royal Bank of Canada economic bulletin),
May 2000, p. 4 (17) In the August 2000 issue of its bulletin entitled The Fiscal Balance in Canada (http://www.fin.gc.ca/fiscbal/fiscbal_e.pdf), the Department of Finance of Canada wrote, “Both levels of government will face increased future spending pressures as a result of population ageing.” (p. 15), and noted that in the 1999-2000 fiscal year, the federal and provincial governments recorded the first budget surplus, based on the public accounts, in at least 30 years (p. 3). |
|||||||||||||||||||||||||||||||||||||||||||||||||||||||||||||||||||||||||||||||||||||||||||||||||||||||||||||||||||||||||||||||||||||||||||||||||||
