PRB 02-48E
MARINE TRANSPORTATION
CONTAINERS AND TRADE
Prepared by:
Emmanuel Preville
Economics Division
24 October 2002
TABLE OF CONTENTS
TRADE AND MARINE TRANSPORTATION
WHAT INDUSTRIES USE CONTAINERS?
AGRI-FOOD EXPORTS MOVING THROUGH CANADIAN PORTS
ECONOMIC IMPACT OF CANADA’S MAIN PORTS
-
Since 11 September 2001, the movement of goods and people across Canada’s borders, by air, truck, rail and sea, has received much attention. This paper addresses the marine transportation of goods.
-
Although marine transportation represents a small part of the transportation industry in terms of the value of goods moved, it represents a sizeable part in terms of tonnage and volume.
-
The growing importance of containers in marine transportation is a key factor in addressing security issues.
-
The use of containers in marine transportation plays a major role in Canada’s agri-food export sector, especially for pulse crops, meat and vegetables.
-
Container traffic is concentrated in Canada’s main three ports: Vancouver, Montréal and Halifax.
MARINE TRANSPORTATION:
CONTAINERS AND TRADE
Important security issues, notably at borders, have emerged since 11 September 2001. In dealing with those issues and ensuring the safe movement of people and goods across our borders, closer attention must be given to trade and marine transportation using Canada’s main ports – Vancouver, Montréal and Halifax.
TRADE AND MARINE TRANSPORTATION
Commercial transportation has an important role in the Canadian economy. In 2001, the value of transportation services throughout Canada directly accounted for 4.1% of Gross Domestic Product (GDP). Truck and marine traffic accounted for 1.3% and 0.1%, respectively, of this total (see Table 1). Perhaps more important, however, many industries depend on transportation. Transportation-related final demand accounted for 14.9% of total expenditures in the economy in 2001.(1)
Table
1 – Commercial Transportation as a |
||
| Industries |
$ Million (1997) |
%GDP |
| Air |
4,205.2 |
0.4 |
| Rail |
4,901.1 |
0.5 |
| Water |
1,083.3 |
0.1 |
| Truck |
11,899.8 |
1.3 |
| Other |
11,886.6 |
1.8 |
| Transportation |
38,563.4* |
4.1 |
Source: Transport Canada, Transportation in Canada,
2001: Annual Report.
* Includes urban transit systems and transportation.
Canada exported $354.9 billion worth of goods in 1999. Most of these exports were to the United States and moved by truck and rail. Although marine transportation accounted for only 2.2% of the value of Canada’s exports to the United States, it moved 71% of the value of our exports to other countries.
Canada imported $215.4 billion worth of goods from the United States in 1999, mostly by road. Marine transportation accounted for only 1.3% of this amount. The value of Canada’s imports from non-U.S. countries was $104 billion, and 38% of these were moved by boat.
|
Table 2 – Canadian Trade with United States: Value, Volume
and Mode, 1999 |
||||||
|
|
Exports |
Modal Share % |
||||
|
|
|
Road |
Rail |
Marine |
Air |
Other* |
| $ Billion |
308.1 |
60.2 |
22.8 |
2.2 |
5.7 |
9.1 |
| Million tonnes |
307.5 |
24.0 |
19.0 |
16.3 |
0.2 |
40.6 |
|
|
Imports |
Modal Share % |
||||
|
|
|
Road |
Rail |
Marine |
Air |
Other* |
| $ Billion |
215.4 |
81.1 |
7.8 |
1.3 |
9.4 |
0.4 |
| Million tonnes |
106.2 |
49.2 |
13.6 |
33.4 |
0.9 |
2.8 |
Source: Transport Canada, Transportation in
Canada, 2000: Annual Report.
* “Other” includes energy pipeline trade.
| Table 3 – Canadian Trade With Non-U.S. Countries: Value, Volume and Mode, 1999 |
||||||
|
|
Exports |
Modal Share % |
||||
|
|
|
Road |
Rail |
Marine |
Air |
Other* |
| $ Billion |
46.8 |
6.6 |
1.7 |
70.9 |
21.0 |
0 |
| Million tonnes |
182.3 |
1.7 |
0.3 |
97.7 |
0.3 |
0 |
|
|
Imports |
Modal Share % |
||||
|
|
|
Road |
Rail |
Marine |
Air |
Other* |
| $ Billion |
104.7 |
34.7 |
3.3 |
38.2 |
23.0 |
0.5 |
| Million tonnes |
69.6 |
9.1 |
1.3 |
83.5 |
1.3 |
4.8 |
Source: Transport Canada, Transportation in Canada, 2000: Annual Report.
* “Other” includes energy pipeline trade.
Although the value of goods moved by boat is relatively small, the importance of marine transportation becomes much more apparent when looked at from the perspective of volume or tonnage. In 1999, Canada shipped 307 million tonnes of goods to the United States and 182 million tonnes of goods elsewhere in the world. With regard to shipments to the United States, the tonnage moved by boat (16%) was comparable to the tonnage moved by train (see Table 2). Furthermore, boat shipments to non-U.S. destinations accounted for almost 98% of the volume of goods exported (see Table 3).
On the import side, the volume of imports by boat from the United States was relatively high (33%), and imports from other countries to Canada mainly travelled by boat.
WHAT INDUSTRIES USE CONTAINERS?
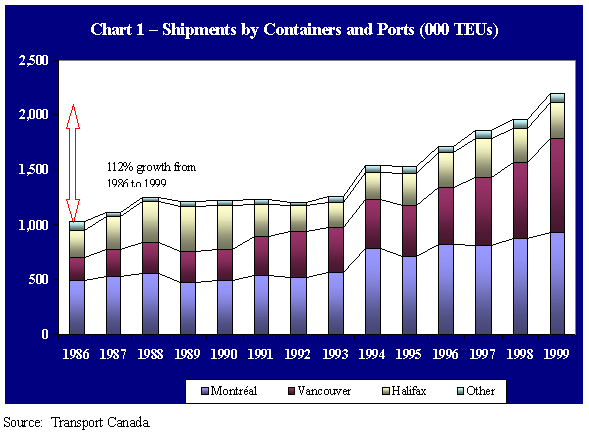
Canadian ports handle 9% of the total number of TEUs(2) handled in North America.(3) For Canada, this was equivalent to 2 million potentially non-secure trucks entering the country through the nation’s ports in 1999 (see Chart 1). Containers accounted for 6.9% of the total volume of shipments in Canada. Transport Canada expects that by 2005, containers will be used in the movements of 8% of the total volume.(4)

General cargo (miscellaneous manufactured items, plastics, textiles, etc.) accounted for 98.9% of the containerized tonnage in 1999. Containers were used to transport 18.1% of general cargo (23.1 million tonnes). The largest single commodity carried in containers was machinery/equipment and miscellaneous cargo, accounting for 8.0 million tonnes and 34.3% of the total container freight.
In 2000, Canada used an estimated 1.1 million TEUs to export goods, about one third of which were agri-food products. The breakdown of agri-food product export containers is shown in Table 4. Within the industry, two sectors in particular – meat and fish; and fruits and vegetables – rely heavily on containers for transportation to foreign markets.
AGRI-FOOD EXPORTS MOVING THROUGH CANADIAN PORTS
Canada’s major ports are vital gateways in the national transportation system. Their links to railway and road systems are essential for transporting both exported and imported goods, especially to and from other continents.
Table 5 offers an overview of port activity across the country. Canada’s three leading container ports, Vancouver, Montréal/Contrecoeur and Halifax, handled 95.2% of all containerized cargo in 1999. Saint John also has container facilities and traffic but remains marginal in comparison to the ports previously mentioned.
| Table 4
– Canadian Exports of Agri-Food Products |
||||||
|
|
Vancouver |
Share |
Montréal |
Share |
Halifax |
Share |
| Est. TEUs |
% |
Est. TEUs |
% |
Est. TEUs |
% |
|
|
|
|
|
|
|
|
|
| Animal/Vegetable Oils |
1,360 |
0.6 |
0 |
892 |
1.5 |
|
| Barley |
4,057 |
1.9 |
0 |
|
0 |
|
| Beverage and Tobacco |
1,851 |
0.9 |
0 |
|
2,951 |
5.0 |
| Cereals, Other |
25,339 |
12.1 |
15,969 |
20.5 |
1,337 |
2.2 |
| Crude Animals (Inedible) |
8,358 |
4.0 |
0 |
|
0 |
|
| Dairy Products |
8,459 |
4.0 |
1,342 |
1.7 |
1,650 |
2.8 |
| Flaxseed |
652 |
0.3 |
49 |
0.1 |
0 |
|
| Fodder and Feed |
60,336 |
28.8 |
643 |
0.8 |
5,284 |
8.9 |
| Fruits, Vegetables and |
|
|
|
|
|
|
| Food Products |
41,507 |
19.8 |
35,335 |
45.3 |
22,421 |
37.6 |
| Meat and Fish |
56,442 |
26.9 |
12,099 |
15.5 |
34,556 |
58.0 |
| Wheat |
1,416 |
0.7 |
391 |
0.5 |
121 |
0.2 |
| Food, Miscellaneous |
0 |
|
7,031 |
9.0 |
3,397 |
5.7 |
| Seeds, Other |
0 |
|
0 |
|
1,361 |
2.3 |
| Corn |
0 |
|
2,544 |
3.3 |
0 |
|
| Sunflower |
0 |
|
2,574 |
3.3 |
0 |
|
| Total Food |
209,777 |
100.0 |
77,977 |
100.0 |
59,572 |
100.0 |
| Total All Containers |
554,113 |
|
332,212 |
|
186,862 |
|
| % Food to Total |
|
|
|
|
|
|
| Containers |
38% |
23% |
32% |
|||
Source: S. Thompson and D. Spearing, “Terrorism and Containers: The Impact of Security Measures on Container Traffic,” 2002.
TEUs were estimated for pulses and cereals using 12 tonnes as a weight, and 7 tonnes for meat.
|
Table
5 – Tonnage Handled at Canadian |
||||
|
Ports |
Loaded |
Unloaded |
Total Handled |
Container Activity |
|
Vancouver |
63,306.7 |
6,499.3 |
69,806.0 |
x |
|
Sept-Îles |
19,532.0 |
1,523.1 |
21,055.1 |
|
|
Montréal |
7,296.7 |
13,073.5 |
20,370.2 |
x |
|
Saint John |
8,866.0 |
10,824.2 |
19,690.2 |
x |
|
Québec |
5,287.4 |
11,000.0 |
16,287.4 |
|
|
Halifax |
7,395.8 |
6,854.3 |
14,250.1 |
x |
|
Hamilton |
996.8 |
10,442.2 |
11,439.0 |
|
|
Thunder Bay |
8,488.9 |
417.0 |
8,905.9 |
|
|
Windsor |
2,161.6 |
3,275.1 |
5,436.7 |
|
|
Others |
19,051.2 |
12,614.9 |
31,666.1 |
|
Source: Statistics Canada, Shipping in Canada 1999.
The export of agri-food products, particularly fruits and vegetables, pulse crops (peas, lentils, etc.), fodder and feed, and meat and fish products, by containers to U.S. and non‑U.S. destinations is a major part of the marine transportation industry. Most agri-food products transit through the Port of Vancouver (see Chart 2).

Source: Ports of Vancouver, Montréal and Halifax.
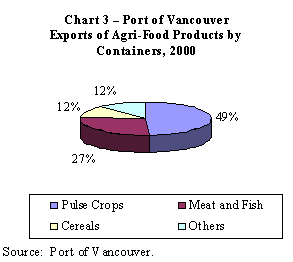
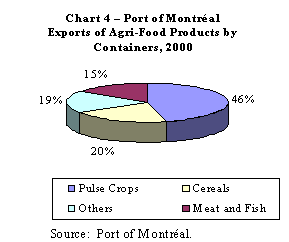
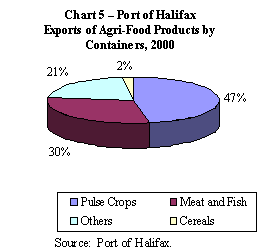
Charts 3 to 5 show the percentages of the major agri-food commodities exported by containers – pulse crops; meat and fish; cereals; and other products – for Vancouver, Montréal and Halifax.


ECONOMIC IMPACT OF CANADA’S MAIN PORTS
Canada’s major ports are also important in sustaining employment, generating local economic activities, providing local people with access to essential resupply services, and facilitating business or pleasure travel.
-
The Port of Vancouver generates 27,500 direct jobs and 18,500 indirect jobs, and almost $3.5 billion annually in economic activity.
-
The Port of Montréal generates some 17,600 direct and indirect jobs, and almost $2 billion annually in economic activity.
-
The Port of Halifax generates over 9,000 direct and indirect jobs and approximately $650 million annually in economic activity.
(1) Transport Canada, Transportation in Canada, 2001: Annual Report.
(2) Containers are commonly 8 feet by 8 feet by 20 feet, or 8 feet by 8 feet by 40 feet; they are measured in terms of the 20-foot container, known as a TEU (twenty-foot equivalent unit). Most ships can carry 6,000 to 8,000 TEU containers.
(3) American Association of Port Authorities.
(4) Transport Canada, “Commodity Flows by Sector – Canada – Marine,” available online via the Transport Canada web site.