BP-367E
BUDGETS 1993:
FEDERAL AND PROVINCIAL
RESPONSES TO RISING DEFICITS
Prepared by Marion G.
Wrobel
Economics Division
December 1993
TABLE
OF CONTENTS
C. Debt, Deficits and Interest Costs
A.
Ontario
1.
Revenue Trends
2.
Expenditure Trends
3.
Debt, Deficits and Interest Costs
4.
Federal Measures to Limit Transfers
5.
Deficit Control Measures
6.
Economic Forecasts
B.
Quebec
1.
Revenue Trends
2.
Expenditure Trends
3.
Debt, Deficits and Interest Costs
4.
Federal Measures to Limit Transfers
5.
Deficit Control Measures
6.
Economic Forecasts
A.
British Columbia
1.
Revenue Trends
2.
Expenditure Trends
3.
Debt, Deficit and Interest Costs
4.
Federal Measures to Limit Transfers
5.
Deficit Control Measures
6.
Economic Forecasts
B.
Saskatchewan
1.
Revenue Trends
2.
Expenditure Trends
3.
Debt, Deficits and Interest Costs
4.
Federal Measures to Limit Transfers
5.
Deficit Control Measures
6.
Economic Forecasts
C.
Alberta
1.
Revenue Trends
2.
Expenditure Trends
3.
Debt, Deficits and Interest Costs
4.
Federal Measures to Limit Transfers
5.
Deficit Control Measures
6.
Economic Forecasts
D.
Manitoba
1.
Revenue Trends
2.
Expenditure Trends
3.
Debt, Deficits and Interest Costs
4.
Federal Measures to Limit Transfers
5.
Deficit Control Measures
6.
Economic Forecasts
A.
Prince Edward Island
1.
Revenue Trends
2.
Expenditure Trends
3.
Debt, Deficit and Interest Costs
4.
Federal Measures to Limit Transfers
5.
Deficit Control Measures
6.
Economic Forecasts
B.
Nova Scotia
1.
Revenue Trends
2.
Expenditure Trends
3.
Debt, Deficits and Interest Costs
4.
Federal Measures to Limit Transfers
5.
Deficit Control Measures
6.
Economic Forecasts
C.
New Brunswick
1.
Revenue Trends
2.
Expenditure Trends
3.
Debt, Deficits and Interest Costs
4.
Federal Measures to Limit Transfers
5.
Deficit Control Measures
6.
Economic Forecasts
D.
Newfoundland and Labrador
1.
Revenue Trends
2.
Expenditure Trends
3.
Debt, Deficits and Interest Costs
4.
Federal Measures to Limit Transfers
5.
Deficit Control Measures
6.
Economic Forecasts
B. Changes to Equalization Payments
BUDGETS 1993:
FEDERAL AND PROVINCIAL RESPONSES TO RISING DEFICITS
The year 1993 has continued to be difficult for Canadian governments. The federal government's fiscal position is now known to be significantly worse than originally thought, with no sign of improvement in the near term. The provinces are still recording close to record deficits, despite implementing a wide range of measures to raise taxes and cut spending.
A common complaint of provincial premiers has been with respect to unilateral cutbacks to federal transfer payments. These restraint measures have cost the provinces dearly and the fiscal position of the federal government means that previous funding levels are unlikely to be restored. It should also be pointed out that most provincial references to federal transfers are only to the cash portion and ignore the amount that is transferred via tax points.
This paper examines eleven budgets tabled this year, the federal government's and those of the ten provinces. Updated material for the federal government is also included. The paper is designed to enable the reader to identify at a glance the various fiscal trends and to compare and contrast the fiscal policies being conducted in Canada by the various governments.
This paper includes material from various budgets, which do not always use the same terminology or accounting conventions, especially in discussing the deficit and the debt. Where budgets are summarized, the accounting conventions used by the appropriate government are employed here as well. But in addition, consistent conventions are used to enable the reader to make comparisons among provinces.
In addition to these budgets, the material in this paper comes from the Annual Fiscal Monitor published by the Department of Finance in November 1993, the speech by the Hon. Paul Martin at L'École des Hautes Études Commerciales on 29 November 1993, information provided by the Investment Dealers Association of Canada and material from the Canadian Tax Journal.
All references here are to fiscal years ending 31 March. The year ending 31 March 1993, often cited as 1992-93, is here referred to as 1993.
The 1993 federal budget was tabled in the House of Commons on 26 April 1993. It came on the heels of an Economic And Fiscal Statement tabled by the Minister of Finance on 2 December 1992. In the fall of 1993, the preliminary fiscal figures for 1992-93 were released in the Annual Fiscal Monitor and on 29 November 1993, the new Minister of Finance, the Hon. Paul Martin, announced revised fiscal figures for 1993-94.
In 1993, federal revenues were $122,900 million, just over $1,100 million less than had been forecast the previous December and only 8% higher than in 1990. While personal income tax receipts over this three-year period were up by 13%, to $58,700 million, corporate income taxes were down by 35% and total sales and excise tax revenues were down by almost 4%. The only other area of strong revenue growth, which in this case indicates poor economic performance, is premium revenues from unemployment insurance, which grew by 63%.
Over this period, unemployment insurance has become the second largest revenue source for the federal government, now accounting for 15% of all revenues. And the personal income tax has continued to grow in dominance. In 1990 it accounted for 46% of revenues and in 1993 it accounted for 47.7%. Moreover, federal accounting changes understate the increasing dominance of the PIT since 1990.
Federal spending since 1990 has been growing at a faster pace than revenues: it has grown by 11%. Program spending grew by 14.5% while debt charges grew by less than 2%, thanks to falling interest rates.
Growth in spending has been driven by a 30% increase in transfers to persons, which in turn is the result of much higher unemployment insurance payments. Major transfers to other levels of government grew by only 9%, if the value of tax transfers is ignored. When the value of tax point transfers is included, the three-year increase is closer to 12%. Other transfers, to natives, business and the farming sector, grew by 25% over three years.
C. Debt, Deficits and Interest Costs
The 1993 federal deficit, according to the budget, was $35,500 million. This represented a $1,100 million increase over the estimate produced just the previous December in the Minister of Finance's Economic Statement, and it was 16.4% higher than in 1990. This three-year increase is not very dramatic, but it is much worse than the declining deficit trends that the government was predicting in 1990.
Thus in 1993, the net public debt stood at $458,600 million, compared to $351,000 million in 1990 and in contrast to the $428,000 million that the 1990 budget had forecast for 1993. Despite these disappointing deficit results, debt servicing costs have shown little change from 1990 as a result of substantially lower interest rates.
While the federal government budget statement expressed some disappointment with regard to the growth of the deficit, it took little action. Certain measures had been undertaken earlier in December, when the government had cut $775 million from spending. The 1993 budget further cut operating costs of the government and extended and deepened cuts announced earlier. Most of these expenditure reductions were not immediate, but were to take place in 1994 and later.
Although the federal government had to revise its economic projections for 1993, it continued to predict strong economic renewal, starting in 1994. With real growth averaging more than 4.3% over the next five years, and employment growth at better than 3%, the government has predicted unemployment at 7.5% in 1998.
And it is this strong economic performance upon which the government bases its 6% per year medium term revenue growth and its rapid deficit decline.
In November 1993 the Department of Finance issued its preliminary financial results for the fiscal year 1992-93, showing a deficit of $40,500 million. This was $5,000 million higher than the amount predicted in this year's budget. The Annual Fiscal Monitor noted that 1993 revenues actually fell from the previous year due to continued sluggish economic growth.
Nevertheless, almost three-quarters of the deficit increase was ultimately due to an increase in program spending from the amounts suggested in the budget. Some of this is predictable. Unemployment Insurance benefits increased as did elderly benefits. Cash transfers for established programs financing were up by over 26% because the decline in personal and corporate income tax receipts reduced the value of tax points which had to be recouped with cash.
Some of the other spending increases are less obvious. Payments to "other" Crown corporations increased by $750 million, a 31% increase. According to the Department of Finance publication, most of this "... was attributable to valuation adjustments to more properly reflect the estimated realizable value of the government's investment in its corporations." This likely means that the government's investment position is not as good as was previously thought.
In addition, other program spending increased by 15.7%, a $2,700 million increase. Part of this is due to a one-time decrease in operating expenditures experienced in 1992, already accounted for in the budget. Other factors specified in the publication include the cost of the constitutional referendum.
For the fiscal year 1994, the latest estimates indicate a deficit in the neighbourhood of $45,000 million. This is about $12,500 million higher than the budgetary estimate. The Minister of Finance attributes this change to lower economic growth in 1993 and 1994 which will result in lower tax revenues and higher payments in the form of low income credits. The 1993 budget predicted economic growth of 2.9% in 1993 and 4.6% in 1994. The Minister has reduced these estimates to 2.5% and 3% respectively.
Poor economic performance also means that the federal government is subject to stabilization claims from the provinces; $1,200 million is budgeted for this eventuality. In addition, one-time claims, such as faster processing of refunds and failure to pass certain legislation, will adversely affect the 1994 deficit by about $2,000 million.
Ontario and Quebec constitute the economic heartland of Canada. These are the two largest economies in Canada and it is here that Canadian manufacturing activity is concentrated. It is also here that the recent recession has been felt the hardest.
Ontario is the more prosperous of the two provinces and its financial position prior to the onset of the recession was better than that of Quebec. Ontario ran a budgetary surplus in 1990 amounting to $9 per capita at the same time as Quebec ran a deficit equal to $248 per capita.
This relative position has now changed. In 1993, the Quebec deficit is $488 per capita while the Ontario counterpart is more than $1,000.
The Ontario budget was tabled in the Legislative Assembly on 19 May 1993.
In 1989 the province of Ontario collected total revenues of $36,991 million which grew to $41,799 million by 1993, an annual growth rate of 3.1%. Revenues for 1994 are expected to grow by 5.4%.
During this period the personal income tax share of total revenues has remained fairly constant at just under one-third of total revenues. The retail sales tax share has dropped from 20.7% in 1990 to 17.5% in 1993 while taxes on corporations fell from 11.5% to 6.5% over the same period. Transfers from the federal government rose from 13% to 18.1% of total revenues despite federal restraint in this area. The Ontario budget records $300 million in fiscal stabilization transfers for 1993.
Expenditure growth by the provincial government has been quite rapid. From 1989 to 1993, total spending grew by 8.7% per annum to reach $53,789 million, while operating expenditures grew by 9.3% per year. Capital spending was much more restrained, growing annually by only 2.5%. In 1990 total expenditures equalled 15.1% of provincial GDP; today they account for 19.6%.
The biggest increase has been spending in the area of community and social services, which increased from $4,955 million in 1990 to $8,566 in 1993, a 20% annual growth rate. In 1994 social services spending is expected to grow by another 4%. This component accounted for 13% of operating expenses in 1990 but now accounts for 17.8%.
Health care spending has been growing by 9% per year since 1990, while spending on housing has grown by 31% per year. This latter component is, however, a much smaller part of total spending than either health care or social services spending.
3. Debt, Deficits and Interest Costs
In 1990, the Ontario government enjoyed a $90 million surplus. This became, two years later, a $10,930 million deficit. In 1993 it grew by about $1,000 and the government expects that it will fall to $9,159 million in 1994. On account of these developments, the 1994 debt, at $78,628 million, will be twice as high as the 1990 debt.
Public debt interest cost the government $5,350 million in 1993, up from $3,817 million in 1990. For 1994 it will rise to $7,150 million and consume 16.3 cents of every revenue dollar, up from 9.3 cents in 1990.
4. Federal Measures to Limit Transfers
In 1993, the Ontario government received over $7,500 million in cash transfers from the federal government. This is expected to fall almost 10% in 1994. Ontario is one of the three non-equalization receiving provinces whose Canada Assistance Plan transfers have been limited to a 5% annual growth rate. Social assistance spending in the province has been growing at much faster rates.
In 1993, the Ontario government received $300 million in fiscal stabilization revenues from the federal government. The province views this as only an interim payment and is continuing negotiations with the federal government on this score.
The Ontario government announced measures in the budget to reduce its status quo deficit by about $8,700 million on a full year basis. Almost one-half is to come from expenditure management initiatives, another $2,000 from the social contract provisions, while another $1,600 million is to come from tax increases. Better asset management is expected to generate $900 million in savings.
The social contract was designed to reduce public sector compensation by $2,000 million from the $43,000 million compensation package. The government announced at the time of the budget that it would undertake negotiations with public servants to prevent the lay-off of 20,000 to 40,000 persons. Despite this, it was planning on cutting 5,000 jobs from the 1991-92 payroll.
A variety of measures make up the $4,000 million expenditure-control plan. Just over $1,000 million is to come from the health sector, another $375 million from education, while streamlining of government and the freezing of discretionary spending will contribute $1,076 million in savings. The remainder comes from cuts to transfer payments to individuals and municipalities ($543 million in savings) and other program cuts.
The other component of the deficit-cutting measures are from tax increases, expected to garner $1,630 million in 1993-94 and $2,047 million when fully in place. Almost 50% of this is the result of income tax increases, in which the tax rate is raised to 58% of Basic Federal Tax, and from the increases in the surtax. The basic surtax is increased from 14% to 20% of provincial tax in excess of $5,500 and the additional surtax is raised from 6% to 10% on provincial taxes in excess of $8,000.
While the budget did not increase the retail sales tax rate, it greatly increased the base by taxing such things as insurance premiums (automobile insurance premiums are taxed at a reduced rate of 5%), parking fees, sand gravel and stone, and by taxing parts and labour supplied under warranty. The budget also taxed beer and wine made at brew-on-premise establishments.
And finally, the budget altered some corporate tax provisions. It announced the introduction of a corporate minimum tax and it reduced from 80% to 50% the proportion of entertainment and meal expenses that could be deducted from corporate income for the purposes of calculating tax liabilities.
Ontario was hit particularly hard by the last recession and the Ontario government forecasts a strong provincial economic recovery over the next few years. Over the next four years, Gross Domestic Product and employment are both expected to increase faster in Ontario than in the nation as a whole. In fact, the Ontario growth rate is projected to be better than that of all G-7 nations. Real output is expected to grow by about 3.5% per year starting in 1993 while employment is forecast to grow by almost 2.5% per year. By 1996, the Ontario unemployment rate should fall to below 9%.
The Ontario budget forecasts assume a continuation of low inflation and low interest rates which will make Canadian unit labour costs more competitive with their American counterparts and help to promote growth in durable goods, especially the residential housing market.
The Quebec budget was tabled in the National Assembly on 20 May 1993.
Total revenues in 1993 were 14% higher than in 1990. In 1993, the government of Quebec received revenues of $35,477 million, of which $27,663 million came from its own sources and of which $7,814 million came from the federal government in the form of cash transfers. While 1992 and 1993 were both years of modest revenue growth, it was only in 1993 that own-source revenues fell very slightly and this was offset by the unusually large increase in federal cash transfers which grew by more than 15%.
In 1993, tax revenues behaved as one would expect given economic conditions. Personal and corporate income taxes fell and sales tax revenues were flat. Indeed, corporate tax revenues are still below 1990 levels while personal income taxes are 11.5 % higher.
Tobacco taxes are continuing their decline from 1991 levels, likely due to the effects of illegal sales.
Government expenditures grew by a total of 24% between 1990 and 1993. Health and social services spending has grown by a similar amount while training and income maintenance spending has been growing at twice the rate.
At $40,455 million, budgetary expenditures in 1993 equalled 25.5% of provincial GDP, slightly lower than the 1984 peak due to the previous recession. The projected figure for 1994 is 24.8% of GDP. In 1990 budgetary expenditures consumed only 22.3% of provincial GDP.
3. Debt, Deficits and Interest Costs
In 1993 the deficit of the government of Quebec reached $4,978 million, three times the 1990 amount. This deficit, equal to 3.1% of provincial GDP, has resulted in a direct debt at an all time high of 24.5% of GDP. Interest costs, at $4,766 million, now consume just under 10 cents of every revenue dollar.
As a result of the previous recession, the deficit peaked at 3.8% of provincial GDP in 1985.
4. Federal Measures to Limit Transfers
In 1993 the government of Quebec received a 15% increase in federal cash transfers. As a result, such transfers accounted for 22% of provincial government revenues. This was a temporary reversal of a longer term trend in which the federal cash share has declined from 28.9% in 1984 to a forecast level of 15.8% in 1998. Cash transfers are expected to fall every year after 1993.
A new matter of contention has been the federal government's decision to use preliminary Statistics Canada population data, adjusted for under-coverage, for the purposes of determining transfer levels. The government of Quebec estimates that this will result in an annual reduction in transfers of $161 million from 1995 to 1999.
The 1993 Quebec deficit is about $1,200 million higher than was forecast in the 1992 budget. As a result of this shortfall, the government has frozen wages for a two-year period, and cut operational expenditures by 6%. Future program spending will be constrained to 1% growth per year. Drug and optometrist re-imbursements are brought under tighter control and the government intends to bring university tuition fees more in line with the Canadian average.
On the revenue side, the government has introduced an income tax surtax of 5% of tax in excess of $5,000 and another 5% on tax in excess of $10,000. Indexation of the tax system has been suspended for one year and the government announced its intent to tax disability income. As in Ontario, the deduction for entertainment and meals is reduced to 50% of the amount spent.
On the basis of these measures, and the anticipated improvement in the economy, the government foresees a slight budgetary surplus by the year 1998. If all goes according to plan, the ratio of direct debt to GDP should have declined to 21.8% and be on a clear downward path by that time.
The budget projects medium term economic growth averaging 3.4% per year, creating 64,000 jobs annually, with employment growing by 2% per year. The unemployment rate is expected to stay high, averaging 11.8% between 1994 and 1998. On the employment side, the Quebec forecast is much less optimistic than the Ontario forecast.
The four provinces of western Canada are economically and financially quite diverse. Alberta and British Columbia do not receive equalization payments from the federal government, whereas Saskatchewan and Manitoba are part of the group of "have not" provinces. Of the four, Manitoba suffered the worst as a result of the recession.
The British Columbia budget was tabled in the Legislative Assembly on 30 March 1993.
Unlike other governments in Canada, the provincial government in British Columbia continues to experience relatively healthy revenue growth. Revenues in 1993, at $16,022 million, are 8.6% higher than the year earlier and they are expected to grow another 8.9% in 1994. Tax revenues have been increasing every year. While personal and corporate income taxes declined somewhat in 1993, other taxes made up for the shortfall. The introduction of a much higher corporation capital tax added directly $255 million to provincial coffers.
Cash transfers from the federal government have been increasing by an average of only 2.4% per year since 1990, compared to 6.4% per year for all revenues and 8% per year for tax revenues. In 1994, cash transfers from the federal government are expected to decline to $2,365 million from $2,497 million in 1993.
Since 1990, total government expenditures have grown at an annual rate of 9.4%. This is about 50% higher than the growth in revenues. Growth in spending this year declined to 5% and it is forecast to grow by almost 6% next year. These rates of spending growth are high by the standards of other governments in Canada.
Spending has grown fastest in the area of social services, education and public protection. Health expenditures are actually growing at a rate less than the average. Social services are increasing now at a rate of about 17% per year. Spending on general government operations has been curtailed since 1992, a trend which is expected to continue.
At $13,250 million, in 1990, total government spending equalled 17.2% of provincial GDP. By 1993 this had grown to $17,972 million, equal to 20.2% of GDP.
3. Debt, Deficit and Interest Costs
As of 31 March, 1990, government direct net debt stood at $4,200 million. It grew to $8.964 million as of 31 March 1993 and is expected to grow even more to $10,538 million next year.
The provincial deficit on both current and capital account has increased greatly. In 1992 it reached a high of $2,355 million, almost four times as high as the previous year. It has declined to $1,950 million in 1993 and is expected to fall even further next year to $1,535 million.
As might be expected, a rapid accumulation of debt is going to lead to higher debt servicing costs. In 1992, these charges grew by 21%. They grew by 27% in 1993 and are expected to grow by another 21% in 1994. In 1990, debt servicing consumed only 3.7% of total revenues. In 1994 this is expected to consume 5.7% of revenues, low by the standards of other governments, but substantially more than was the case a few years ago.
4. Federal Measures to Limit Transfers
The British Columbia government does not rely heavily upon fiscal transfers, which account for 14% to 16% of total revenues. The variety of federal measures affecting transfers to the provinces affect B.C. as well, including the provisions limiting Canada Assistance Plan transfers that apply to the non-equalization receiving provinces. A study commissioned by the province indicates that in 1993 and 1994 the province would have essentially balanced its books had it not been for these federal measures.
This study does take into account the fact that part of the EPF transfers comes through the transfer of tax points. But about 25% of the added burden attributed to federal measures is really an indirect cost, not a direct one. The study assumes that the province does not react in any way to changes in federal transfers. Thus these reductions lead directly to higher deficits or lower surpluses which impose higher interest costs on the government. The BC government is unique in including these costs in its estimates of the impact of federal transfer reductions.
The British Columbia economy has performed well over the past few years by Canadian standards. It has a modest debt burden and its deficit, expressed as a percentage of provincial GDP, is the lowest in the country. Nevertheless, the high rate of expenditure growth has required the government to take measures designed to curb growth in the deficit.
On the revenue side, the budget contains measures that would increase total revenues for general purposes by just over $800 million per year. The most notable of these include: an increase in the provincial sales tax from 6% to 7%, the application of the sales tax to certain services such as automobile repairs, and the increase in the provincial surtax. The high income surtax will now be set at 50% of provincial tax payable in excess of $9,000.
The budget does not contain any significant spending controls. It does freeze the salaries of MLAs and senior administrators and cuts some operating expenses, but the savings pale in comparison to the tax increases. Instead, the budget refers to earlier cost-cutting measures applied to the bureaucracy that have saved about $300 million. Nevertheless, the increase in program spending is now in the neighbourhood of 4% to 5%, high by the standards of other provinces but lower than the double digit increases that were experienced two and three years ago.
In 1992, the British Columbia economy grew by 2.4%, well above the 1% growth rate for the national economy. Employment grew by 1.9% in the province while it declined nationally. The province remains a favourable destination for immigrants and sectoral conditions, such as the dramatic increase in lumber prices, favour economic growth in the BC economy. In 1993, the provincial economy is expected to grow faster than its Canadian counterpart, while in 1994 the two should be about equal at 3.4% annual growth. The unemployment rate is expected to remain steady at 10.4%, despite employment growth of 2.3% in each of 1993 and 1994.
The Saskatchewan budget was tabled in the Legislature in March 1993.
In 1992, the total income of the Saskatchewan government was $4,052 million. It grew by 7.7% in 1993 and is expected to grow by another 6% in 1994. This revenue growth is strong by comparison to other provinces. This growth is largely due to growing tax revenue as well as rising revenues from fees and licences.
Transfers from the federal government, representing about 27% of total revenues, have been essentially static since 1992, as have revenues from non-renewable resources sources of income. But the province is forecasting increases in personal income tax receipts, corporate capital taxes as well as strong growth in corporate income taxes which in 1994 is expected to be twice the level of two years earlier.
In 1994, total spending is expected to be 0.5% higher than in 1992, with the increase due entirely to higher debt servicing costs. Program spending and capital spending are both declining over time, with the former declining by 2.5% per annum and the latter falling by 20% per year. In 1994, the province expects to spend a total of $4,928 million, of which $3,900 million is on programs, $180 million is on capital projects and $848 million represents the cost of servicing the debt.
3. Debt, Deficits and Interest Costs
Debt servicing costs are rising quickly, from $523 million in 1992 to $848 million in 1994. This represents an average annual increase of 27%. The reason for this is clear. The recent budgetary deficits of $846 million in 1992, $592 million in 1992 and the projected figure of $296 million in 1994, have contributed greatly to the rise in the net debt position of the government. When added to the write off of $1,453 million in assets in 1992, these factors have caused the accumulated deficit to grow from $3,688 million as of 31 March 1992 to a forecast amount of $7,676 million as of 31 March 1995, a doubling in three years.
4. Federal Measures to Limit Transfers
The budget notes that federal transfer changes have created some fiscal problems for the province, but it does not go into great detail. The government had estimated earlier that the freeze in EPF funding and the change in the manner of calculating equalization payments cost it about $200 million in 1992. It now claims that total federal off-loading, including agricultural programs, costs the province $500 million per year. If not for this, the budget would be balanced.
The budget puts in place a plan for balancing the budget by 1997. The 1993 budget provides for almost $800 million in spending cuts which are only partially offset by about $250 million in increases in other areas. The government aims to achieve these cuts by rationalizing the delivery of government services, cutting 1995 funding for hospitals, schools and universities, and municipalities by 2.8%, 4% and 8% respectively, in addition to cuts announced in last year's budget.
On the revenue side the government has increased the sales tax rate to 9% and broadened the base of application. Gasoline taxes have been increased by 2 cents per litre and the tax on resource sales of larger corporations has been increased from a rate of 3% to 3.6%. These three measures are expected to raise revenues by $176.5 million in 1994.
To achieve a balanced budget in 1997, the government is counting on an essential freeze in operating expenditures and a 4% per year increase in total revenues.
From 1993 to 1996, the government is forecasting economic growth which averages 2.3% per annum, a figure which is less than that predicted for the national economy. Employment is expected to grow by less than 1% per year.
The Alberta budget was tabled in the Legislative Assembly on 6 May 1993. It was updated on 8 September 1993. What follows is based on the updated version of the budget.
Total revenues in 1990 were $9,720 million. By 1992 they had grown to $11,630 million, representing an annual increase of 9.4%. Revenues declined in 1993 to $11,470 million (15.3% of provincial GDP) and are expected to decline again by a very slight amount in 1994. From 1992 to 1993, personal income tax receipts dropped by about 9% while corporate income taxes fell by about 13%. Investment income from the Heritage Fund, which in 1992 accounted for 12% of total revenues, dropped by 28%. Cash payments from the federal government increased in 1993 but are expected to drop slightly in 1994. At $2,794 million, the personal income tax is the most important revenue source for the government, accounting for 24% of total revenue.
In 1993, non-renewable resource revenues increased by 8%. They accounted for 19% of total revenues that year. For 1994, the government uses a forecast figure which is the average of actual revenues for the five years previous. This amounts to a forecast 6% increase.
In 1990, total expenditures were about $12,057 million. This grew to $13,402 million in 1992, an annual growth of 5.4%. Spending grew by a further 6.3% in 1993, equalling 19% of provincial GDP. Family and social services spending grew by $138 million (8.6%) and the new employment transfer program cost $200 million. Education spending also grew faster than average at 6.6% while health care spending increased by less than 5%.
Total spending in 1994 is forecast to decline by almost 6% while program spending is to decline by 7.7%.
In 1993, expenditures under the Treasury category exhibited an enormous one- time increase. Total expenditures were $873 million instead of the amount originally budgeted, $255 million. There are two reasons for this increase. The government has altered its accounting conventions in response to recommendations of the Auditor General. In addition, it has adjusted downward the recorded value of a number of its assets. The largest such revaluation is in respect of the Lloydminster upgrader where the government wrote down the value of its investment by $217.3 million.
3. Debt, Deficits and Interest Costs
As of 31 March 1993, the net debt of the Alberta government stood at $11,824 million. This amount is far above earlier figures because of accounting changes introduced by the government. In particular, the net debt now reflects unfunded pension liabilities of $4,500 million that were not reflected earlier. Thus comparisons with earlier years are misleading.
The consolidated deficit for 1993 is $3,409 million (4.5% of provincial GDP) and it is projected to fall by about $1,000 million next year and show a surplus of $220 million by 1997. In 1991, the deficit was about $2,000 million. Debt servicing costs in 1993 were $1,219 million, less than 11% of total revenues.
4. Federal Measures to Limit Transfers
The 1993 budget has nothing to say about the matter. Alberta is subject to the same restrainst as Ontario and British Columbia.
The Alberta government has enacted this year the Deficit Elimination Act, which puts in place a four-year timetable for the achievement of a consolidated budget balance and mandates such a balance every year after 1996.
These targets are to be met through a series of spending cuts, which would amount to a 20% reduction in program spending by 1997. These cuts are targeted at all aspects of government program delivery. The budget contains no tax increases, although it does increase health premiums by 11%.
The Alberta economy grew by 2.2% in 1992, compared to a national growth rate of only 0.7%. Indeed, it has outperformed the national economy since 1990. The government is basing its projections on economic growth of 3% per annum until 1997. The unemployment rate for the near term is expected to be 1.5 percentage points below the national average.
The 1993 Manitoba budget was tabled in the Legislative Assembly on 6 April 1993.
Total revenues fell by about 1% in 1993, to $4,895 million, as a result of lower tax revenues. While income tax revenues were up, sales tax revenues declined. Federal transfers were growing only slightly and are expected to decline in 1994. Total 1994 revenues, at 19.2% of provincial GDP, are forecast to be less absolutely and relatively than the 1992 results, which equalled 21.1% of GDP
Revenue growth from 1990 to 1994 is averaging 1.3% per annum.
Program spending since 1990 has been growing at an annual rate of 2.8%, twice as high as revenue growth. Program spending is forecast to decline by almost 2% in 1994, to $4,809 million. Welfare spending, which is expected to grow by 4.5%, is the only major expenditure class to see an increase.
At $5,359 million, total spending in 1994 should amount to 21% of provincial GDP, down from 22.7% the year before.
3. Debt, Deficits and Interest Costs
As of 31 March 1993, the general purpose net debt of the province stood at $6,200 million, almost 17% higher than the year before. It was equal to 26% of provincial GDP. Total net debt, including that of the provincial hydro corporation as well as others was $12,778 million, equal to 53.5% of GDP.
Manitoba has been steadily running a deficit since 1990. In 1993, the deficit at $530 million was 64% higher than the previous year. Since 1990, the deficit has grown at an annual rate of 55%.
The government portrays the 1993 deficit as $330 million. This amounts to 1.4% of GDP rather than 2.25% as is the case when the deficit is stated at $530 million.
All lottery earnings go into a separate account, unlike the practice in most other provinces, and the government has established a stabilization fund into which it deposited $200 million in 1989. Withdrawals from these accounts are treated as income and deposits into the stabilization fund are treated as expenditures. While such transactions have no overall impact on the debt, they can alter the timing of reported deficits. Thus a 1989 surplus of $59 million was turned into a $141 million deficit on account of a $200 million deposit into the stabilization fund. Similarly, a $200 million withdrawal in 1993 gave the appearance that the deficit for that year was $4 million less than that for the previous year, when it was in fact $206 million more.
With the exception of 1993, the Manitoba government has generally maintained an operating surplus. The deficit position of the government in the 1990s is actually better than it was in the latter half of the 1980s. Consequently, debt servicing costs have not increased much since 1990, growing annually by only 2.3%.
4. Federal Measures to Limit Transfers
The 1993 budget contains no reference to the cost of federal transfer reductions. The province has not received any stabilization assistance from the federal government.
The government has undertaken revenue and expenditure measures, each of which would reduce the deficit by about $100 million. In 1994, program spending is to be cut by 2% ($100 million), with a further 1% cut in 1995 and a virtual freeze after that. To accommodate this, some agencies are being consolidated, some operating costs are being reduced and the wage bill for the public sector is being reduced by 3.8% through reducing some salaries by that amount (MLAs, judges) and by reducing hours of work for the public service.
On the revenue side, the sales tax base is being broadened and the province has reached an agreement with the federal government to collect provincial taxes at the border. In addition, property tax credits, mainly available to the elderly, are being reduced by about $53 million a year.
These measures are designed to achieve a fiscal balance by 1997. To do so, revenues must increase by 2.7% per year while program expenditures remain frozen at their 1995 levels, which would be 3% less than the 1993 amount.
The budget forecasts economic growth at rates slightly below those for the country as a whole for 1993 and 1992. Unemployment is expected to fall to 8.6% in 1994, from 9.6% in 1992.
The four provinces of Atlantic Canada constitute the poorest region of the country. These provinces have the highest unemployment rates and the lowest per capita incomes in Canada. They also rely heavily on transfers from the federal government.
The financial positions of these provinces vary greatly. In 1992-93, Prince Edward Island recorded a net debt of over $350 million, almost $3,000 per capita and less than 17% of provincial GDP. This is well below the average of the Atlantic provinces. Newfoundland, on the other hand, registered a net debt that year that exceeded 50% of its provincial Gross Domestic Product.
The PEI budget was tabled on 17 June 1993. Although the government has one of the better deficit positions of Canadian governments, its small size and lack of economic diversity have led to one of the worst credit ratings in Canada. In addition, the PEI government is very large in relation to the size of the provincial economy. Consequently, the government is very wary of any significant increases in its deficit and debt position.
Total provincial revenues for 1992-93 are forecast at $723 million, down 5.7% from the amount originally projected in the 1992 budget. The current budget projects revenues for this year to reach $767 million, about the amount originally expected last year. These figures compare with total receipts of $660 million in 1989-90.
Tax revenues last year amounted to 18.2% of provincial GDP. Total revenues constituted 34% of GDP. Last year, the provincial budget overestimated both tax revenues and direct transfers from the federal government; tax revenues proved to be about 8% less than expected at first, while direct federal transfers were about 3.5% less, largely due to a 15% shortfall in equalization payments, which accounted for 56% of total cash transfers from the federal government.
For 1993-94, the PEI government is expecting a further drop in cash payments from the federal government, but a substantial increase in tax revenues and other provincial sources of funds. The 13.8% increase in tax revenues from fiscal 1993 to 1994 would require a substantial upturn in the state of the local economy.
Total spending on current account and net capital account amounted to $689 million in 1990, rising to $806 million in 1992, an increase of 5.4% per annum. Spending in 1992 amounted to 38% of provincial GDP. This is very high by the standards of other provinces. For 1993, total spending is expected to drop to $793 million.
3. Debt, Deficit and Interest Costs
As of 31 March 1993, the net debt of the government of Prince Edward Island stood at $352 million, up from $199 million only three years earlier. The $83.4 million deficit in the last fiscal year contributed greatly to this increase. The cumulative deficit in each of the last two fiscal years is 50% higher than it was in the six years previous. This clearly was a worrying trend for the government. These recent results are also far above the deficits predicted in 1990.
But the budget does include measures to reduce the budget this fiscal year and to restore fiscal balance shortly. From $83.4 million in 1993 (4% of provincial GDP), the deficit should decline to $25.4 million in 1994. By fiscal year 1996, a slight surplus is expected.
This large growth in the net debt of the province has led to a substantial increase in debt servicing costs, which have risen by more than 9% per annum over the last two years. These charges today consume almost 17 cents out of every dollar of revenue, up from 13 cents in 1990.
4. Federal Measures to Limit Transfers
The government of Prince Edward Island relies upon transfers from the federal government for about 45% of its total revenues. Federal restraint measures have hit the provincial finances hard. The cap on the growth of equalization (i.e., limiting its growth to no more than that of the Canadian economy) cost the PEI government about $28 million in 1991 and 1992. In addition, revisions to estimates of personal and corporate income taxes, and a change in the way Statistics Canada undertook its population count have also led to reductions in federal transfers. The provincial government estimates that all of these factors led to a $52- million reduction in federal transfers in 1993.
From 1988 to 1992, the unemployment rate in Prince Edward Island increased steadily from 13% to 17.7% and during this period the deficit ballooned. In 1991, when other provinces were starting to implement expenditure control measures, the PEI government was relying upon tax increases to fix its budgetary problems. At that time, full harmonization of the provincial sales tax with the GST was contemplated, and several income tax increases were put into place.
This time the focus has changed to spending reductions, largely through efficiencies gained in the delivery of government services. For every dollar of revenue increase, two dollars of spending cuts are expected. Tax rates for the personal and corporate income tax, as well as the sales tax, have not been changed. The sales tax base, which was never harmonized with the GST, is broadened, cigarette and gasoline taxes are raised and property tax credits are reduced.
The PEI economy performed better than the national average in 1992 and the provincial unemployment rate in early 1993 was 16.5%, down from 17.7% a year earlier. Growth in 1993 is expected to slow somewhat, and lag behind the national average.
The Nova Scotia budget was tabled in the House of Assembly on 30 September 1993.
In fiscal year 1990, total revenues of the Nova Scotia Government were $3,775 million. Last year they were $3,950 million and are expected to grow to $4,032 in 1994 (21.8% of provincial GDP), an increase of only 2.1%. From 1991 to 1993, total revenues were essentially stagnant, due to declining tax revenues and a diminution of cash transfers from the federal government. The decline in equalization payments, for example, was 16% over the two- year period.
Total government expenditures on both the current and the capital account have been growing modestly in recent years. Although it grew by 5% last year, the longer term trend since 1990 has been for a growth rate under 4%, and the projection for 1994 is that spending will grow by less than 3.1%, to $4,970 million (27% of provincial GDP).
The allocation of spending resources clearly indicates a shift away from discretionary activities and a concentration on those driven by economic and demographic factors. For example, spending on culture and recreation, resource development, transportation and communications has declined in absolute terms since 1990. Spending has been greatest in areas of health, education and social services, as is the case with most provincial governments.
3. Debt, Deficits and Interest Costs
As of 31 March, 1993, the net debt of the province of Nova Scotia stood at $6,860 million, up from $3,947 million in 1989. The net debt has grown 26.5% over the last year and 45% over two years. The net debt for 1993 is about 38% of provincial Gross Domestic Product. The forecast for 1994 is a net debt of $7,529 million, representing 41% of provincial GDP.
The budget notes that the deficiency of ordinary revenues used to finance ordinary expenditures was $471 million in 1993, up from $322 million the year before, a 47% increase. This compares to $61.7 million in 1990. But this is not a true deficit figure; i.e., it does not represent the increase in the net debt position of the government from one year to the next. A better measure is to use net budgetary requirements and subtract net contributions to the sinking fund. On this basis, the deficit for 1993 was $770 million, up from $558 million the year before.
This rapid increase in the net debt position has led to growing debt servicing costs, which have been increasing by 11% per year since 1990. In 1994, interest charges will account for 21% of total spending, up from 16% in 1990.
4. Federal Measures to Limit Transfers
Cash transfers from the federal government in 1994 are expected to be 3% less than they were in 1991. Over the last five years, these transfers have accounted for about 40% of total government revenues. In 1994, they are expected to decline to about 38.4% of revenues.
Equalization payments from the federal government have declined substantially in the last two years while EPF cash transfers have risen only modestly. The only area of fairly strong growth has been with respect to transfers for the Canada Assistance Plan, not a good sign.
The 1994 budget has put into place a four-year plan to bring the province's finances under control. The high income surtax has been increased for a one-year period and has been made into a two-stage tax. The rate is 20% on provincial taxes between $7,000 and $10,499, and 30% on all taxes above that amount. Gasoline taxes have been increased, the provincial sales tax, known as the health services tax, is increased from 10% to 11%, and the base is broadened somewhat.
On the expenditure side the government has cut back operating and capital expenditures from the previous year. In addition, it is putting into place a four-year expenditure control plan that would save $300 million in operating costs and $60 million in capital spending over its lifetime.
The budget forecasts lagging growth for Nova Scotia in the near term. The economy of the province declined in 1992, despite the fact that the national economy grew slightly. Growth in 1993 is expected to be half the national average. Employment will not expand until 1994, when it will be only modest; growth in the economy is forecast at about 2.5%. Thus unemployment will continue high at about 14.5%.
The New Brunswick budget was tabled in the Legislature on 31 March 1993.
Total budgetary revenues in New Brunswick equalled $3,583 million in 1990, rising to $3,690 in 1992 and $3,900 for 1994. Revenues in 1994 are expected to be slightly less than in 1993.
Last year's budget overestimated significantly the receipts from the personal and corporate income taxes. The shortfall on the PIT alone was about $100 million. Fortunately for the government, it underestimated federal transfers by an almost equal amount so that total revenues were just slightly higher than first thought. For 1994, the government is forecasting a rebound in income tax revenues and a slight decrease in federal transfers.
In 1991, the New Brunswick government spent $3,773 million on ordinary account expenditures and $296 million on net capital spending. By 1993, these two components reached $4,452 million, a 9.4% increase. In 1994 this spending is expected to fall by 4.5%.
3. Debt, Deficits and Interest Costs
As of 31 March 1992, the net debt of the provincial government amounted to 31% of provincial GDP, up from 27.6% two years earlier. The deficit, at $494 million for 1993, is slightly less than the 1992 figure of $516 million.
4. Federal Measures to Limit Transfers
The EPF limits are estimated to cost New Brunswick about $180 million in 1993. Although the equalization cap is not currently binding, it has cost the province in the past and could become effective again.
The New Brunswick government put into place this year An Act Respecting the Balancing of the Ordinary Expenditures and Ordinary Revenues of the Province. This law is designed to force the government to balance its current account over a four-year period. The budget predicts that by 1995, the current account will be in surplus.
The budget also calls for revenue and expenditure measures to control the deficit. On the revenue side, the personal income tax rate is increased from 60% of basic federal tax to 62% for the 1993 year and further increased to 64% in 1994. The sales tax base is broadened and the provincial government has made arrangements with the government of Canada to collect provincial tobacco and alcohol taxes at the border. These measures are expected to raise revenues by $75 million.
Expenditure restraint is also used. A moratorium on new capital projects has been announced and the net capital budget is limited to $275 million in 1995 and $250 million in 1996. This compares with net capital spending of $293 million in 1992, $360 million in 1993 and an estimate of $307 million in 1994.
In addition, the provincial Prescription Drug Program is being scaled back, grants are being reduced by $2.8 million and 23 agencies are being consolidated into 6 while another 23 are being eliminated.
The New Brunswick economy has performed better than the rest of Atlantic Canada so far in the 1990s and this trend is expected to continue. In 1992, employment rose in the province, while it fell in the rest of the country. While the Canadian unemployment rate increased about 10% in that year, it was steady in New Brunswick.
The unemployment rate in 1993 is expected to be 11.5% and economic growth after that year is predicted to average 4.7% per annum.
The 1993 Newfoundland budget was tabled in the House of Assembly on 18 March 1993.
In 1990, total revenues of the government of Newfoundland were $2,931 million. By 1994 they are expected to be $3,182 million, representing an annual increase of 2.1%. Tax revenues in 1994 are expected to be 5% higher than in 1993.
The retail sales tax generates more revenue for the Newfoundland government than does the personal income tax. The corporate income tax is in fourth place, behind gasoline tax revenues.
In 1990, total net expenditures of the provincial government were $2,748 million. In 1993 this amount had increased to $2,946 million, an annual increase of 2.3%. For 1994, total expenditures are expected to increase by 3.3% to $3,043 million.
3. Debt, Deficits and Interest Costs
Total provincial consolidated direct debt, less debt of the utility corporation, equalled $3,709 million in 1989. By 1993 it had risen to $4,685 million. The provincial deficit has fallen steadily since 1991, when it reached $347 million. By 1993 it was $265 million and is expected to fall further to $223 million in 1994.
Debt charges in 1993 amounted to $492.5 million, 16% of total spending. This is an increase of $10 million from the 1992 debt charges.
4. Federal Measures to Limit Transfers
In 1987, the federal government contributed 48.5% of the provincial government's revenues via cash grants. This has since declined to 43%. The province must repay $70-million in overpayments for 1992 and 1993 as a result of adjustments to estimated population.
The 1993 budget of the Newfoundland government contains no increases in taxes and limits future spending growth to 1.4%, due almost entirely to increasing debt service costs. The deficit on current account (i.e. excluding capital expenditures) is expected to fall by $30 million to $51 million in 1994.
The spending restraint program of the government is based upon a $70 million reduction in total compensation to provincial public servants.
In 1992, the unemployment rate in Newfoundland was just over 20%, with a 4.6% decline in employment over the previous year. The unemployment rate is still expected to increase somewhat, largely as a result of difficulties in the fishing sector. The budget provides no long or medium term forecasts. It offers a provincial growth rate of 1.2% for 1993, largely on account of activity around the Hibernia project.
All Canadian governments have suffered severe financial difficulties since 1990. Although much has been made of the revised deficit numbers for the federal government, it is the provincial figures that are more worrying.
In fiscal year 1991, total provincial deficits were less than $9,500 million, about 31% the federal level of $30,600 million. By fiscal year 1993, the federal deficit had increased to $40,500 million but the provincial deficiencies had increased even faster to $25,000 million; they now totalled 62% of the federal deficit. Total provincial deficits are expected to decline in 1994 while the federal deficit continues to grow.
As a result of these trends, total provincial net debt will be 40.5% as high as federal net debt in 1994, up from 33% of federal debt in 1991. In aggregate, federal and provincial debt will soon equal one year's worth of total output for the Canadian economy.
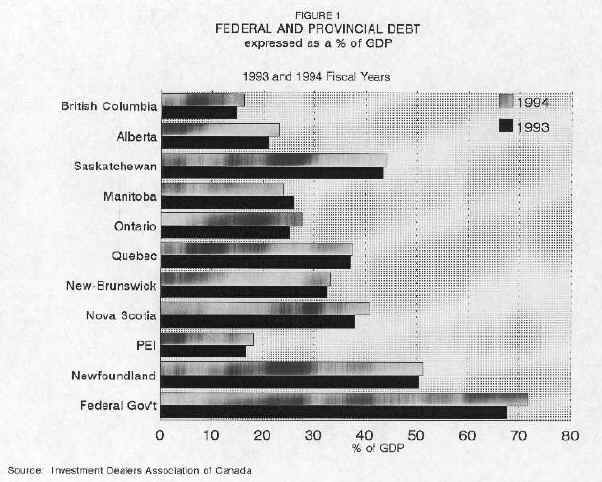
Figures 1 and 2 Figures 1 and 2 should appear shortly thereafterexamine the debt and deficit outlook for the federal and provincial governments according to their most recent financial statements. These figures are presented as a proportion of relevant Gross Domestic Product and have been compiled in a consistent manner by the Investment Dealers Association of Canada.
The past fiscal performance of the federal government, as measured by its accumulation of net debt, is worse than that of any province. Its net debt is now approaching 70% of GDP. Less than 20 years ago, that figure was about 17% of GDP. Newfoundland's net debt is just over 50% of provincial GDP, while Saskatchewan's is approaching 45%.
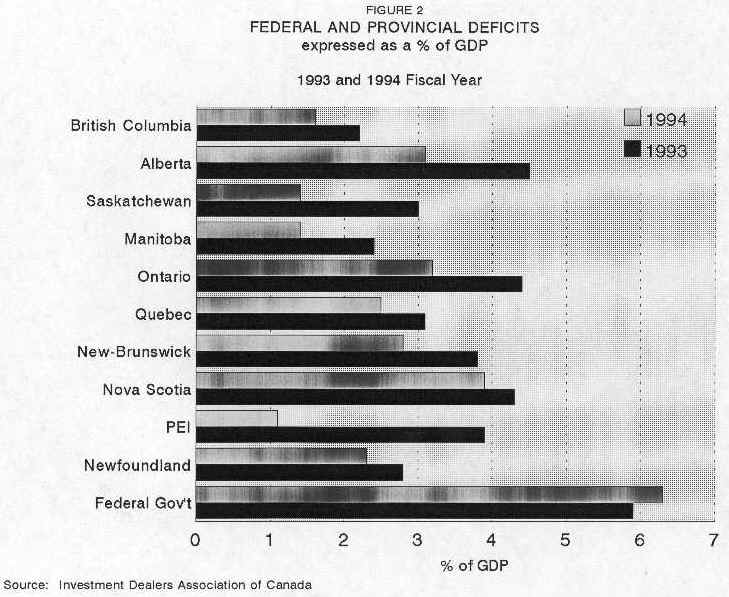
Figure 2, which looks at recent deficit figures, indicates that the federal government is again the worst fiscal performer, even though it has undertaken several steps to reduce transfers to the provinces. In 1993, Alberta, Ontario and Nova Scotia experienced deficits in excess of 4% of their respective GDP. British Columbia and Manitoba had the best performance.
All provincial governments expect to reduce the relative and absolute size of their deficits in 1994. The federal government, on the other hand, expects the 1994 deficit to be almost $5,000 million higher than its 1993 counterpart, with the relative size growing from 5.9% of GDP to 6.3%.
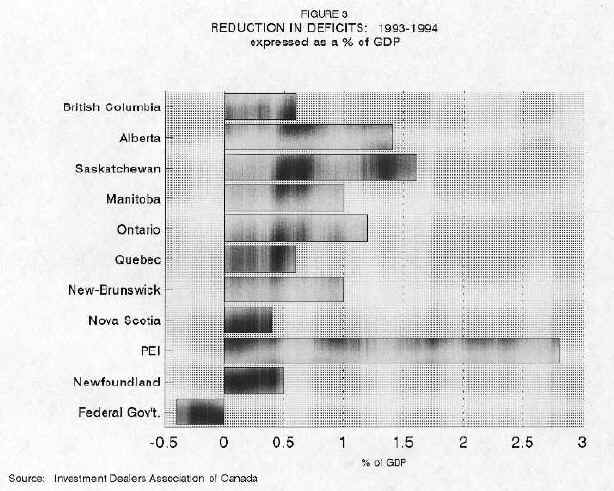
Figure 3 Figure 3 should appear shortly thereafterpresents a graphic illustration of the deficit-cutting measures put in place by the major Canadian governments in their latest financial plans. The deficit of the federal government is expected to grow, as was mentioned above, and, with the exception of Nova Scotia, every province plans to reduce its deficit by at least 0.5% of provincial GDP. When we consider the fact that the 1993 deficit in Nova Scotia is one of the nation's worst and its debt position is third worst of the provinces, this response is quite mild. The government of Prince Edward Island, on the other hand, has taken a very strong short-run approach to deficit cutting. It is cutting the relative size of its deficit by an amount equal to 2.8% of GDP. This is a 70% decrease in one year.
Saskatchewan and Alberta are planning to reduce their deficits by amounts close to 1.5% of GDP. But the Saskatchewan measures have a greater short-term impact on bringing about fiscal balance. In a similar vein, Manitoba, Ontario and New Brunswick are all taking measures to reduce deficits by an amount equal to approximately 1% of provincial GDP. In 1994, however, Manitoba will be in a better financial position than the other two.
British Columbia had the best fiscal performance of any province in 1993. In 1994, that position will likely be held by Prince Edward Island, with Saskatchewan and Alberta also outperforming B.C.
B. Changes to Equalization Payments
In 1994, the federal government will pay the seven equalization-receiving provinces $962 million less than they were originally expecting. This reduction is mostly due to the continued poor performance of the Ontario economy and consequently there is less "equalizing" between the tax capacities of the richer and poorer provinces.
The provinces have largely budgeted for the higher amount and in some instances the new figures will mean a dramatic shortfall in revenues. (See Table 1)
In Saskatchewan, for example, the decline is one-third of the amount originally expected. In Newfoundland and Quebec, the decline is 2% and 3% respectively.
The variation by province is large because of the different economic performances and because of revised population figures. Whatever the case, several provinces will find it more difficult to stick to their deficit targets in light of these revisions.
Table 1
Equalization Payment Revisions for 1993-1994
| Payment 1994 | Reduction from Original |
% Reduction |
|
| Newfoundland | 915 | 18 | 1.93 |
| Nova Scotia | 880 | 169 | 16.11 |
| Prince Edward Island | 176 | 23 | 11.56 |
| New Brunswick | 888 | 86 | 17.32 |
| Quebec | 3633 | 110 | 2.94 |
| Manitoba | 844 | 231 | 21.49 |
| Saskatchewan | 458 | 225 | 32.94 |