BP-329E
THE CANADIAN AIRLINE INDUSTRY:
ITS STRUCTURE, PERFORMANCE AND PROSPECTS
Prepared by:
Odette Madore, Daniel J. Shaw, Economics Division
February 1993
TABLE OF CONTENTS
A PROFILE OF THE CANADIAN AIRLINE INDUSTRY
1. Market Environment
2.
Cost Structures
3.
Fares
4.
Regional Affiliates and International Alliances
D. Entry Barriers and Predatory Pricing
1. Entry Barriers
2.
Predatory Pricing
1. Domestic Service Regulation
2. International Service Regulation
3.
Foreign Ownership Restrictions
1. Corporate Strategy
2. Operational and Financial Performance
1. Corporate Strategy
2. Operational and Financial Performance
COMPETITIVENESS OF AIR CANADA AND PWA CORPORATION
B. Factor Productivities and Efficiencies
C. Corporate and Shareholder Efficiencies
D. Canadian vs. American Air Carrier Competitiveness
APPENDIX 1A: AIR CANADA AND PWA CORPORATION CORPORATE ORGANIZATIONS, 1992
APPENDIX 2: PWA FINANCIAL RESTRUCTURING, 1993
THE CANADIAN AIRLINE INDUSTRY:
ITS STRUCTURE, PERFORMANCE AND PROSPECTS
The Canadian airline industry has undergone significant change since being deregulated in 1987. The freedom to enter and exit any market, to charge any price and to offer any services has immeasurably altered the way airlines operate. The task of their managers has thus become more onerous, since they can no longer deal with a change in market conditions simply by applying to the regulatory authority for an increase in fares. It is now the marketplace that rewards or penalizes air carriers for their responses to the vagaries of demand and supply. Fortunately, most of the adjustment costs resulting from deregulation have already been incurred, and the experiences of the 1990-91 recession will be instructive for airline managers.
This inquiry first provides a broad outline of the current structure of the airline industry in Canada, including the most recent trends for merging with regional affiliates, forging alliances with international carriers, and vertically integrating into computer reservation services. Fare determination, airline cost structures, and air networks are also reviewed. Secondly, this inquiry reviews the performance of the major Canadian airline companies since 1987, and comments on their priorities and corporate strategies. Thirdly, a detailed comparison of competitiveness is made: first between both of Canada's national air carriers, and then between them and their American counterparts. Finally, conclusions with respect to their prospects are drawn.
A PROFILE OF THE CANADIAN AIRLINE INDUSTRY
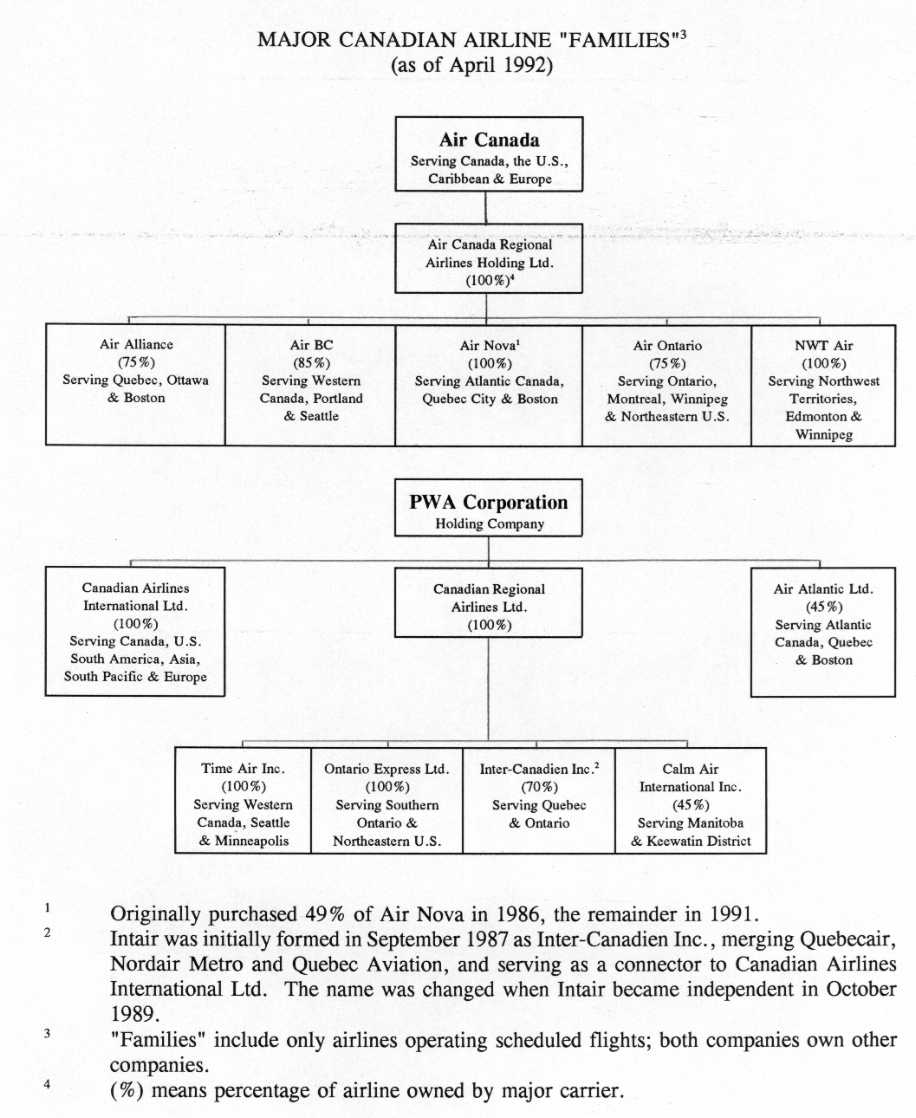
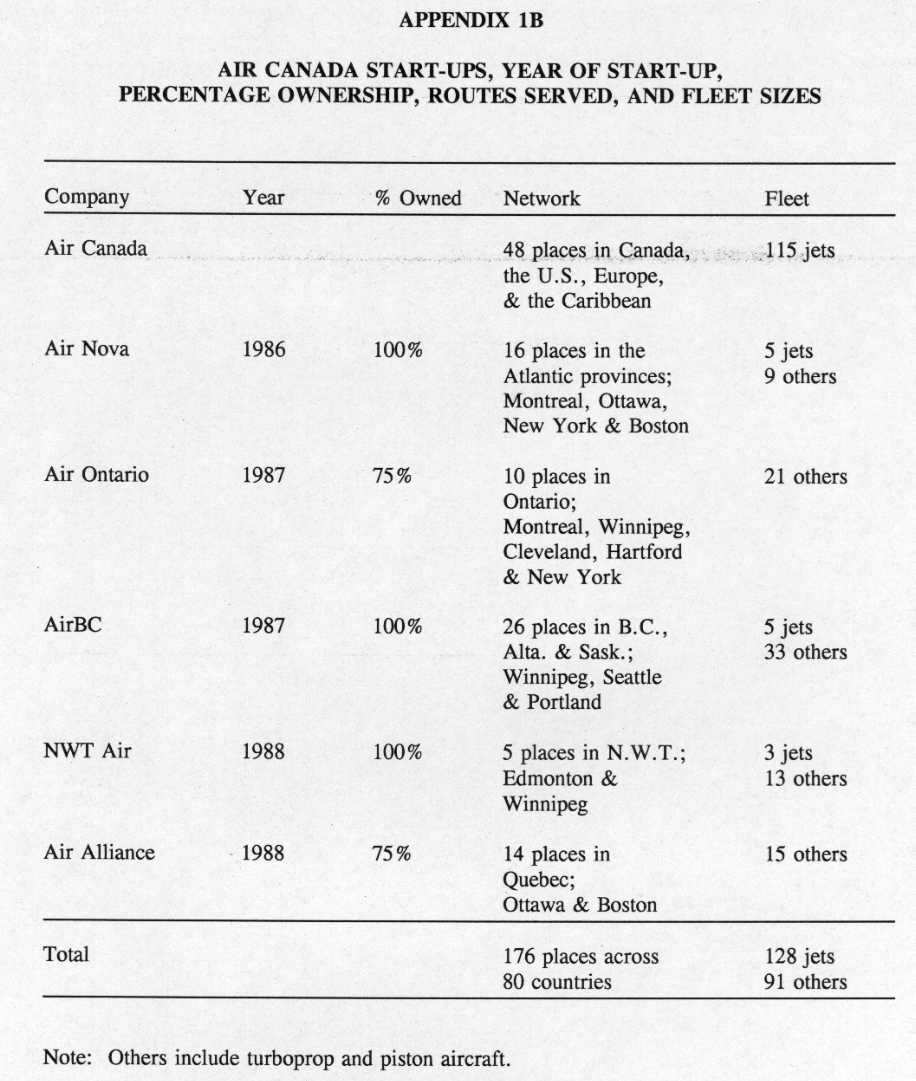
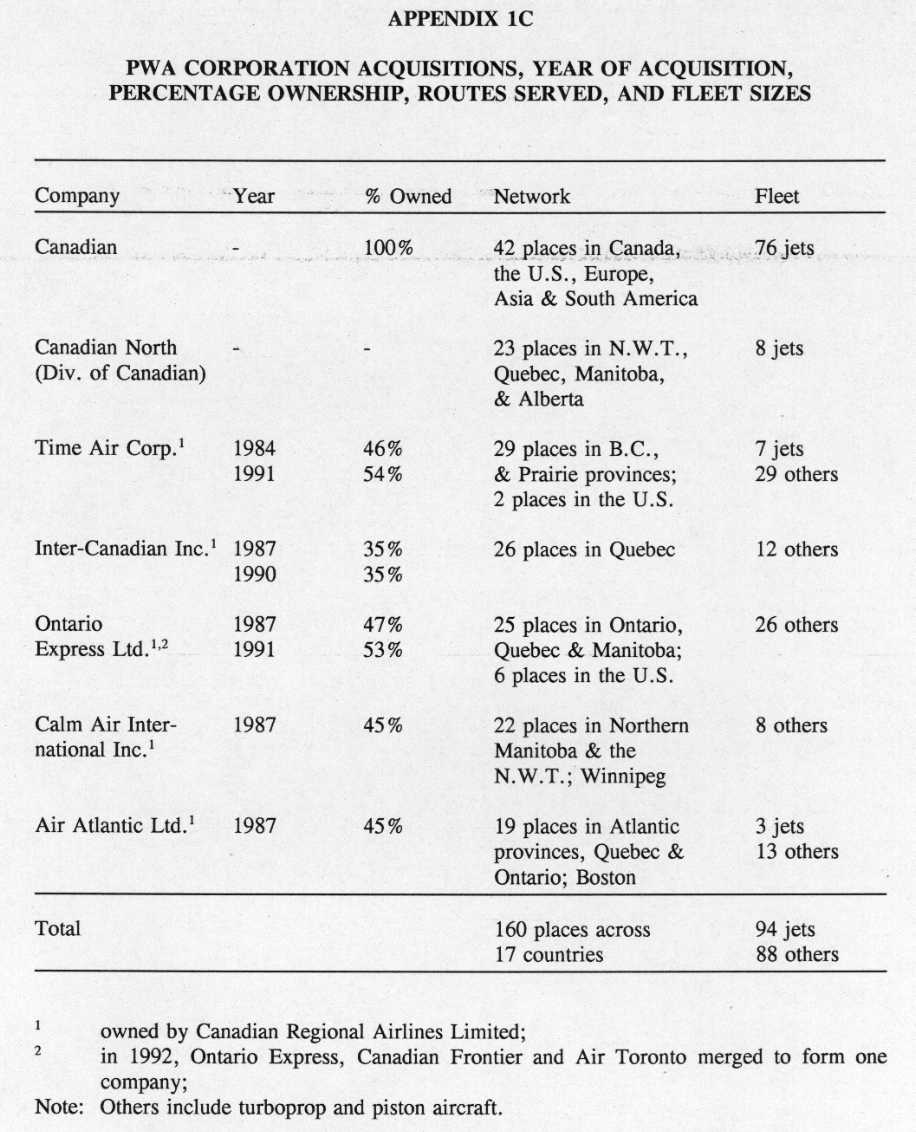
The airline industry in Canada can be characterized as a duopoly dominated by the major carrier families - Air Canada and Canadian Airlines International Ltd. (Canadian); fringe competitors offer primarily charter services with some limited scheduled services to selected large city-pair markets in central and eastern Canada. Both major carriers are affiliated through ownership with regional or specialized local carriers. While Air Canada and Canadian carry passengers and cargo on scheduled and charter flights domestically and internationally, their affiliates generally serve the different regions of the country and a number of transborder centres. Air Canada's affiliates comprise Air Alliance, Air BC, Air Nova, Air Ontario and NWT Air. Canadian's affiliates include Air Atlantic, Calm Air International, Inter-Canadian, Ontario Express and Time Air. Organization charts of the two major carrier families appear in Appendix 1A; the regions served by the affiliates, the year of acquisition or start-up within the family, percentage ownership, and their fleet sizes and composition are shown in Appendices 1B and 1C.
The airline industry makes a significant contribution to the Canadian economy. In 1991, for example, the industry generated $7.6 billion in operating revenues and employed 53,000 people. Moreover, the airlines carried 32 million passengers on domestic and international flights, and almost 640 million kilograms of cargo.(1)
Cargo transported by Canadian carriers accounts for some 20% of the industry's revenue tonne kilometres (RTKs);(2) thus, the industry is dominated by passenger carriage, which, on domestic and international scheduled services, is fairly evenly split: international traffic accounts for approximately 44% of the total and domestic travel for 56%. However, international traffic dominates (97%) cargo traffic. In comparison, for both cargo and passengers the United States has a relatively low proportion of international service (24%), while United Kingdom carriers depend almost exclusively (97%) on international traffic.
Canadian carriers provide almost 50% of scheduled services and 94% of charter services between Canada and the rest of the world.(3) The United States is the largest single market for Canadian carriers both in scheduled and in charter services, followed by Europe, the Caribbean and the Pacific Rim. Air transportation to/from and within Canada, however, accounts for only slightly more than 2% of global air markets.(4)
The airline industry features a number of unique characteristics.(5) First of all, demand is highly seasonal, with peak month air traffic being roughly twice that of the trough month. Secondly, industry activity responds to cycles in the general economy, but in an exaggerated fashion. Finally, it is characterized by high overhead and capital costs, so that small traffic increases or decreases can result in dramatic increases in profits or losses.
The airline industry's cost structure is also unique.(6) Costs are affected by numerous factors. They vary according to the size of the aircraft with, generally, smaller aircraft costing more per seat than larger aircraft. Costs also vary according to flight distances: the average cost per kilometre declines as the flight distance increases. Moreover, there is a relationship between seat costs per unit and the number of seats sold. Since much of the cost of a flight is fixed, the cost per passenger declines as the percentage of seats available are filled.
Finally, it appears that company-wide economies of scale are negligible.(7) This means that the unit cost neither rises nor falls when cities are added to or deleted from a network. There are, however, economies of traffic density: it is possible to reduce the cost per seat when more flights are scheduled or more seats are added to a flight on a given route.
Generally, airlines do not apply simple uniform pricing policies. Rather, they have chosen complex strategies based on a range of demand and supply factors. While they adjust their fares in light of seasonal (peak or trough) or cyclical (recession or boom) conditions, the primary differences in fares are based on different types of passengers, of which there are at least four broad categories on an airline with scheduled services. Listed in ascending order of their responsiveness to the price of air travel, they are: first-class passengers, businessmen, leisure passengers and infrequent travellers. While air carriers cannot directly price discriminate according to the type of traveller, they do so indirectly by establishing three classes of fares: first-class, business-class and economy.(8) The first two are the more expensive tickets while the last is the lowest unrestricted fare offered. Discounts subject to restrictions, such as minimum or maximum stay requirements, no refunds and off-peak travel, are offered to infrequent travellers.
Discount fares are controlled by so-called "yield management systems." This technique involves forecasting with a reasonable degree of accuracy the number of seats that will be unsold on each flight. Air carriers use these forecasts to offer discount fares on the remaining seats to people who would not normally fly. By imposing certain restrictions on these fares, the carriers ensure that their regular, full-fare paying passengers, particularly business travellers who require scheduling flexibility, do not take advantage of them. Carriers may also offer more than one class of discount fare so that passengers sitting side by side on an aircraft may have paid significantly different prices.
Finally, air carriers also offer frequent flyer programs which attempt to reduce the price sensitivity of travellers by instilling customer loyalty. These programs enable travellers to accumulate points and thus reduce the effective cost of the trips they plan to take.
4. Regional Affiliates and International Alliances
The airline industry is also characterized by a recent trend toward alliances and mergers. Two factors account for this development: consumer preference and profitability.
It seems that consumers prefer large carriers (those serving many points) to smaller carriers and prefer itineraries involving only one carrier. Travellers often solicit the large air carriers, which can take them virtually anywhere in the country, rather than the small carriers, which have geographical limitations. Passengers also prefer the time-and-gate-synchronized connections of large carriers, and they feel that there is a lower probability that their baggage will be lost when they deal with only one carrier or travel on only one aircraft. It is partly these preferences that have motivated the major carriers to merge with feeder carriers in Canada.(9) Such mergers are also very profitable for the national carriers, since the few extra passengers generated by the feeder carriers do not require the provision of additional flights and thus do not affect operating costs. Virtually all the fares paid by connecting passengers represent pure profit to the major carrier.(10)
Such factors may also explain the creation of international alliances among the major national carriers. Such alliances, increasingly common in recent years, generate traffic that feeds their domestic networks and helps make them more profitable, as well as supplementing international services. Alliances are in place, rather than mergers, because domestic ownership restrictions prevent foreigners from owning more than 25% of the voting stock of domestic airlines.
Airlines carry people and cargo using a hub-and-spoke network. Each network consists of links (air routes) and nodes (airports). There is no single route system; on the contrary, it is often possible to find several possible itineraries between any two nodes (i.e., between one's origin and destination). The number of route alternatives increases with the distance between origin and destination. Non-stop routes are possible but itineraries frequently involve a stopover at a major airport ("a hub"). Under this arrangement, large number of cities are served by being linked to one main hub. The size of a city and its geographical location are usually the primary factors considered when creating a hub. This system, by adding a node to a passenger's journey in order to concentrate traffic, allows for more frequent service, and thus reduces total travel time. Most consumers prefer a route with more frequent service, even though it may involve a stopover at one of the major hubs and may thus take longer.(11)
The parallel creation of hubs and spokes has led to increased competition among the major international gateways. Domestic air carriers in several countries have responded by forging alliances or merging in part with foreign carriers to take advantage of these gateways. The recent agreement between British Airways and USAir is a case in point. Alliances of this kind have two effects on competition. On the positive side, they permit traffic to be fed on to domestic routes and generate additional economies of traffic density. On the negative side, a domestic-only airline will find it difficult to compete effectively with a combined domestic-international carrier.(12) For most, free entry conditions into the industry would ensure that the first effect outweighs the second, but the existence of significant barriers to entry may preclude this inference.
Canadian air carriers can benefit from such alliances because they offer several advantages for the carriage and handling of international traffic and cargo.(13) First of all, Canada has a geographical advantage in being directly adjacent to the world's largest air market - the United States. Secondly, Canada is located on many of the most important great-circle air routes of the world. For example, traffic from Asia to the United States or South America must fly over or directly alongside Canada. Similarly, traffic from Europe to the United States or from northern Europe to South America also comes near this country. If Canada's carriers are to compete with other international carriers, however, they must be sufficiently cost-competitive; the locational advantage on its own is not enough to capture an important market share.
D. Entry Barriers and Predatory Pricing
"Entry barriers" are obstacles that prevent new companies from breaking into an industry, even though incumbent companies are making extraordinary profits. In the air transportation sector, well-established companies enjoy particular advantages that make it difficult for a new carrier to start up operations.
One such obstacle may be the computer reservation system (CRS), which provides information on flights and fares to travel agents and travellers. The dominant CRS in the country, Apollo, which is owned by United Airlines and operated in Canada by the Gemini Group, is controlled by the two main air carriers, who may attempt to prevent newcomers from accessing the CRS. The on-screen display of the CRS gives priority to the flights of the airline that owns or hosts the system, and it is generally admitted that the services appearing on the first screen generate a disproportionate share of sales. This greatly favours the major airlines and tends to diminish the market share available to small or new carriers. Finally, the host airline encourages independent travel agents to steer consumers to its services by offering additional commissions to travel agents who make extensive use of the CRS and who meet minimum ticket sales quotas. In effect, these "free" agents have been co-opted and are increasingly becoming "aligned" agents. Consequently, the lack of competition in the downstream (CRS services) market can effectively bar entry to newcomers in the upstream (air carrier) market.
Frequent flyer programs, through which airlines offer the possibility of accumulating points, also create a major entry barrier. These programs, which primarily attract business travellers, generally succeed in cultivating customer loyalty for a given carrier. Since it is easier to accumulate points with an established carrier that offers flights to a large number of destinations than with a more modest airline, a de novo entrant or an existing charter airline company trying to enter the scheduled service market will operate at a disadvantage.
Airport size and noise restrictions often limit the availability of gates and take-off and landing slots and may therefore indirectly limit the entry of new carriers. In the United States, take-off and landing slots at Washington National airport and O'Hare in Chicago have reportedly sold for as much as US$1.2 million.(14)
Predatory pricing is a monopolistic practice whereby a dominant firm charges unreasonably low prices for an extended time in an attempt either to preempt actual or potential rivals or to discipline them so as to elicit more cooperative responses (usually in terms of prices or market shares). Predatory pricing is an offence under section 50(1)(c) of the Competition Act, and the Director of Investigation and Research of the Bureau of Competition Policy (hereinafter the Director) regards "an unreasonably low price" to be one below the average variable costs of the firm.
Before a price/cost comparison of the alleged predator is made, the Director investigates the likelihood that such pricing could achieve the anti-competitive objective of preventing market entrance. Market shares, concentration, and conditions of entry are the objects of this investigation, and the determining factor is whether these material facts suggest that the predator could recoup the losses sustained in its predatory efforts by charging higher prices once the competition has been eliminated.
The information that could determine "beyond a reasonable doubt" whether Air Canada was practising predatory pricing is confidential. We can, however, put forward an educated opinion.
In 1991, an Air Canada proposal to buy Canadian's international routes from PWA Corporation (hereinafter PWA, Canadian's parent) was rejected. In early 1992, Air Canada proposed to merge its operations with PWA, but was again rejected. In any event, the second proposal would likely have been unacceptable to both the Director and the Competition Tribunal because of the industry's high concentration and because of the existence of significant barriers to entry, both natural and regulatory. Thus, had the merger come before the Tribunal, the latter would likely have ordered Air Canada to divest itself of Canadian's domestic air routes and assets. Even so, Air Canada would have achieved its primary objective of acquiring Canadian's fast-growing Pacific Rim markets, something which by ordinary means would have been prohibitively expensive because of regulatory oversight.
Twice spurned, Air Canada, it could be argued, then employed more expensive and desperate acquisitory means by discounting its fares, adding capacity to provide more and better service, and building a treasure chest of cash to wage a war of attrition in which the spoils would go to the air carrier with the deepest pockets.
This chain of events would seem to be confirmed by Air Canada's drop in its yield per RTK of 6%, its added capacity of 8%, and the conveniently negotiated financing facility that would enable it to acquire up to US$400 million in credit on an unsecured basis for a term of five years - all of which came about in 1992. This sum is roughly equivalent to the amount of cash and accounts receivable PWA had on its books.
While this predatory pricing scenario appears plausible, it could, however, easily be rebutted. Because of the 1990-91 recession, the first and third steps taken by Air Canada are still consistent with competitive behaviour. Air Canada needs only claim that its added capacity was necessary to meet its earlier commitment to acquire more jets without forfeiture of its deposits. A high burden of proof is required to support charges of predatory pricing, precisely because this is hard to distinguish from competitive pricing.(15)
1. Domestic Service Regulation
Since 1988 the airline industry in Canada has been entirely deregulated, with a few exceptions relating to safety and foreign control. Economic deregulation removed measures designed to control market entry or exit and there are no regulations governing services and fares. Deregulation has allowed the two air carrier families to compete equally and unencumbered on the major domestic routes.
The federal government has, however, retained some regulation of air services in the North and in the more distant areas of the country, especially with respect to market entry and fare controls. These regulations are designed to ensure essential services to and from these distant but underpopulated markets. The area subject to this type of protection is located to the north of a line beginning on the 50th parallel on the Atlantic coast and moving gradually to the 55th parallel in Alberta and British Columbia.
2. International Service Regulation
Regulation of international air services, on the other hand, is based on terms established by bilateral agreements between Canada and other countries. In North America there is increasing talk of policies designed to open up air carrier markets to competitive forces. Two such policies in particular could result in a restructuring of the Canadian airline industry.
The first is an "open skies" policy, whereby a Canadian or American carrier could offer services on any transborder route at any time. Canadian and American companies would compete freely for flights between the two countries. An open skies policy would also intensify the activities of the North American hub-and-spoke networks. It is generally acknowledged that the principal carriers of the major hub airports would enjoy substantial advantages in cost savings, improved flight frequencies, and thus greater market share.
The second policy is "cabotage," whereby a Canadian airline could carry Canadians from one point to another in the United States and vice versa.
3. Foreign Ownership Restrictions
Canadian air carriers are also subject to regulations governing foreign ownership. To operate air passenger services in Canada a company must belong to a Canadian citizen or Canadian resident or be subject to de facto Canadian control, whereby at least 75% of the voting shares must belong to Canadians. This restriction ensures that foreign interests cannot gain voting control of a Canadian carrier. Similar regulations exist in other countries.
Recently a number of industry analysts have asked whether the limit on foreign ownership should be raised. It is thought that this would give Canadian carriers greater flexibility in reaching agreements with foreign carriers and provide for more efficient global air networks. Most experts feel, however, that, for security reasons, effective control of Canadian carriers must continue to be exercised by Canadians.
The global airline industry has rapidly evolved in recent years; a market environment that could best be described as highly regulated and highly fragmented along national lines has come to be characterized by trade liberalization and private enterprise. The resultant restructuring of the industry to larger, more integrated air route networks and the opening up of cross-border and international markets present Air Canada with many opportunities for growth, the only constraint being to achieve and maintain a competitive corporate profile. Air Canada's strategy for prosperity in the 1990s will be to increase its market presence, particularly in the fast-growing markets of Japan and Southeast Asia. Route acquisition, whether by direct or indirect purchase or through alliances with foreign airlines, will be the company's first priority.
Air Canada has well-established alliances with Air India, Air Jamaica, Air Liberté, All Nippon Airways, Austrian Airlines, CSA, Finnair, LOT Polish Airlines, Pakistan International Airlines, Royal Jordanian Airlines, Sabena, Singapore Airlines and VIASA. In 1992, Air Canada forged an alliance with United Airlines and, in 1993, with a Texas-based partner acquired Continental Airlines Inc., pending approval from the necessary regulatory bodies.
Air Canada has a solid cash position from which it can weather the current economic storm, but successful market expansion in the 1990s likely implies the need for increased financial leverage for the company. Consequently, an equally important priority must be debt reduction. Cost reductions through greater operational efficiency and higher productivity will also be important.
2. Operational and Financial Performance
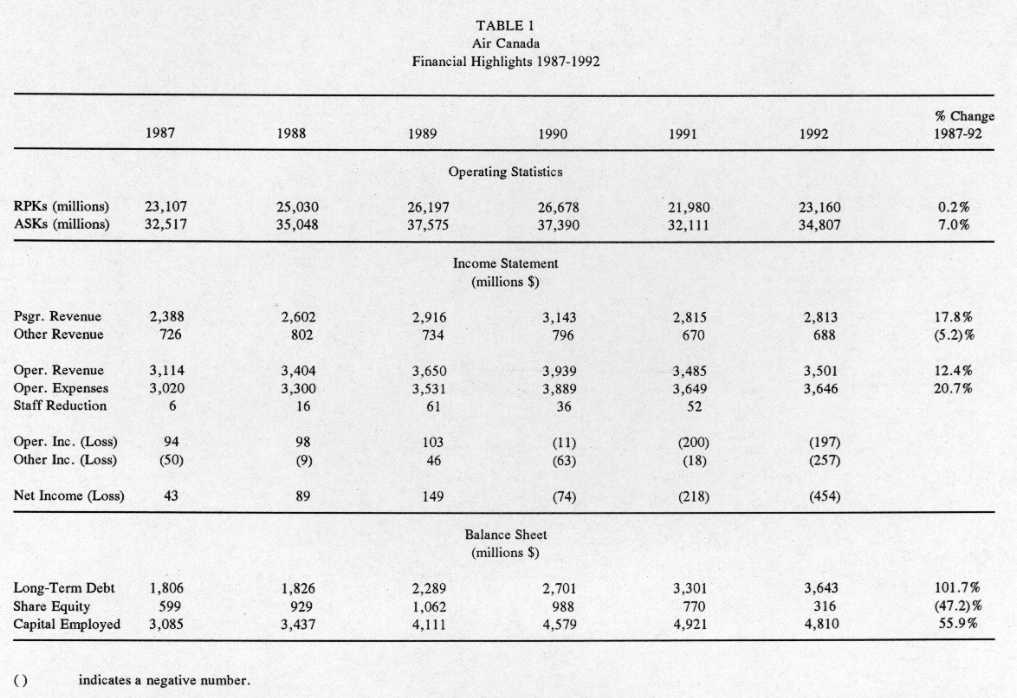
Air Canada's passenger traffic volume had grown steadily through the 1987-90 period until the 1990-91 recession produced a decline. The year 1992 was one of recovery, but Air Canada's traffic volume was only slightly better than that recorded in 1987 (see Table 1).
Source: Air Canada, Annual Report 1991 and 1992.
Not surprisingly, growth of operating costs outpaced that of revenues in the 1987-91 period, so that an operating profit of $94 million in 1987 became a loss of $200 million in 1991. Air Canada responded to these poor market conditions by discounting ticket prices on specific routes to produce a 6.3% decline in its average yield per revenue passenger kilometres (RPKs) in 1992; reducing available seat kilometres (ASKs) by 14.1% to about 32 billion in 1991; closing reservation offices in St. John's, Calgary, Edmonton and Halifax; and laying-off over 2,500 employees. This reduced the loss from operations to $197 million in 1992.
The undepreciated book value of Air Canada's assets as of 31 December 1992 was approximately $4.8 billion, up from $3.1 billion at year-end 1987, representing a 55.9% increase in just five years. These assets were financed primarily by taking on more debt. Total long-term debt amounted to $3.6 billion as of 31 December 1992, which is $1.8 billion or 101.7% higher than at year-end 1987. Consequently, Air Canada's net worth is 47.2% lower today than at that date.
Similarly, PWA's economic prospects will be largely determined by its ability to adapt to the changing world air transport environment, which includes trade liberalization, airline deregulation and the privatization of state-owned airlines. These developments entail the opening up of previously closed foreign markets and the increased competition within the world airline industry that together are setting the pace for the emergence of globally integrated airline networks. In seeking strategic allies with suitable and compatible networks, PWA has established alliances with Air France, Air New Zealand, Alitalia, Japan AirLines, Lufthansa, Mandarin Airlines, Qantas and Varig Brazilian Airlines.
Strengthening the balance sheet also remains a high priority for the corporation, both for the short and long term. It has depended on a high degree of financial leverage to make its acquisitions in recent years and to fulfil its commitment to an ambitious widebody fleet renewal program started in 1988; thus, debt reduction will be critical for optimizing the corporation's long-term strategic position.
A third priority of the Corporation must be to improve its cash or liquidity position. An airline's operating results are particularly sensitive to changes in the general level of economic activity, exchange rates and fuel costs. These three factors over which the airline has no control, when combined with the relatively high fixed-to-variable costs ratio of the industry, mean that participants must have strong cash balances.
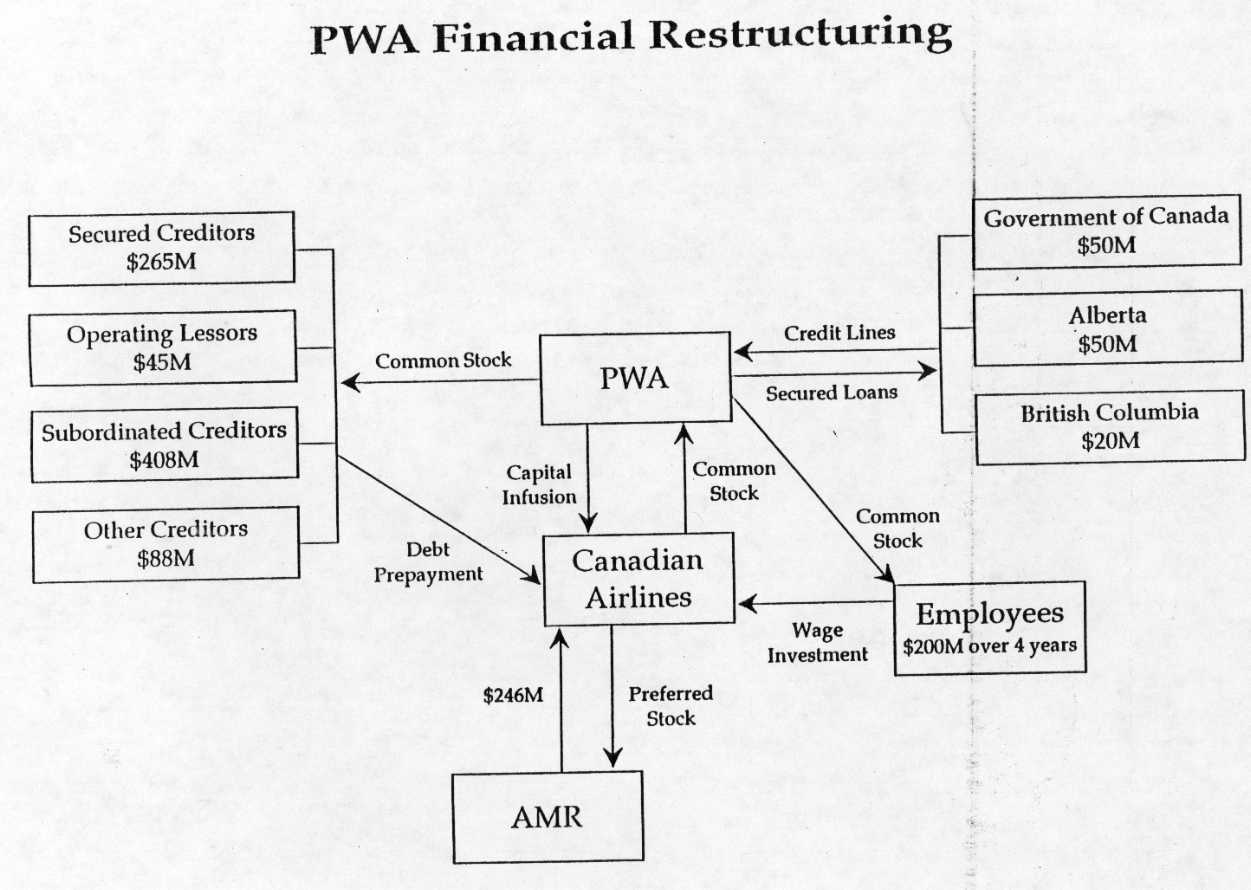
PWA cannot realize these goals on its own. Management has not adapted effectively or efficiently to the prevailing conditions. Only through a merger with AMR Corporation (American Airlines' parent) to provide a capital infusion of $246 million, employee share purchases to provide an additional capital infusion of $200 million over four years, creditor restructuring through swapping debt for equity, federal government landing fee deferrals, employee wage freezes, and temporary federal and provincial government loan guarantees will PWA be able to stave off bankruptcy (see Appendix 2).
2. Operational and Financial Performance
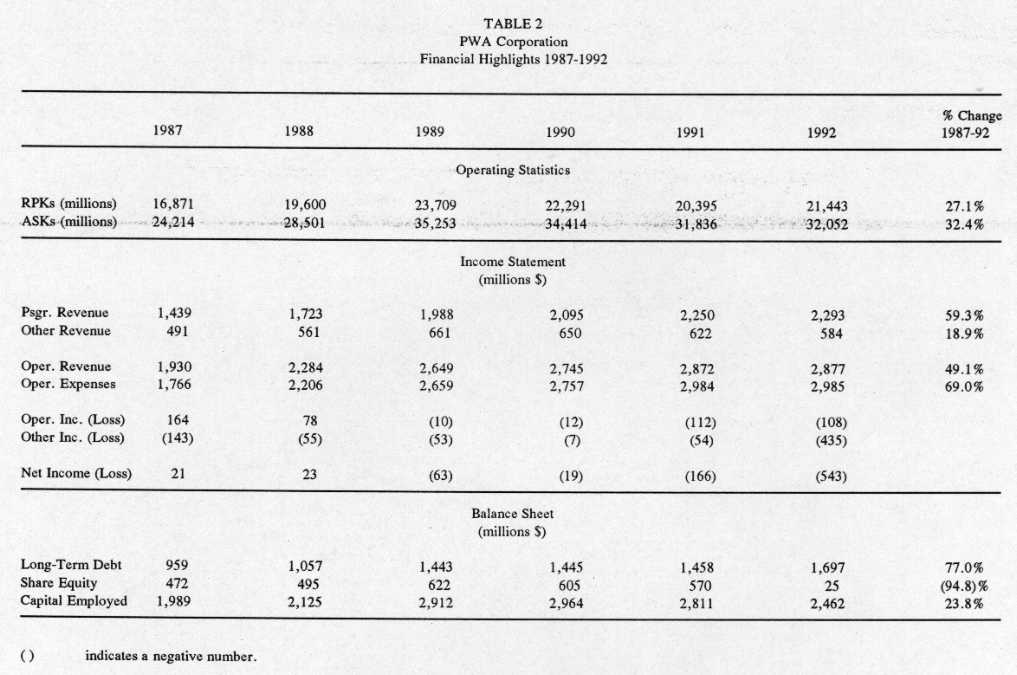
Air travel had grown steadily through the 1980s (even through the 1981-82 recession); however, the conflict in the Persian Gulf, further exacerbated by the economic downturn of 1990-91, brought about a decline in world air travel for the first time in civil aviation history. PWA was not immune to these developments. The company's RPKs peaked in 1989 and continued to decline until its recovery in 1992 (see Table 2).
Operating results deteriorated steadily in this period, from a profit of $164.3 million in 1987 to a loss of $112.1 million in 1991. The fastest growing item on PWA's operating ledger has been the depreciation and amortization expenses (100% between 1987 and 1991), incurred by the fleet modernization initiative of 1988. While this program has had the effect of reducing cash operating costs through greater fuel efficiency and lower maintenance costs, it has also contributed to the company's poor cash flow performance.
In response to the economic downturn, Canadian discontinued its unprofitable routes to Peru, Australia and New Zealand; reduced capacity as measured by ASKs by 7.5% to about 32 billion; and reduced staff levels by 1,200. As a result, operating losses in 1992 were reduced to $108 million, representing an improvement of 3.6% from 1991.
Source: PWA Corporation, Annual Report 1991 and 1992.
The undepreciated book value of PWA's assets as of 31 December 1992 was approximately $2.5 billion, up from $2 billion at year-end 1987 but down from its peak of $3 billion at year-end 1990. This represents a 23.8% increase in the book value of the Corporation in just five years, which was largely achieved by the purchase of Wardair Inc. in 1989. The bulk of the assets, however, were acquired through debt financing. Total long-term debt amounted to about $1.7 billion as of 31 December 1992, $738 million or 77% higher than at year-end 1987. Consequently, the net worth of PWA is 94.8% lower today than at that time.
COMPETITIVENESS OF AIR CANADA AND PWA CORPORATION
The purpose of this section is to determine the strengths and weaknesses in the competitive positions of both airline companies, first in relation to each other, and then in relation to American airline companies. We consider: airline networks; factor costs, productivities and efficiencies; corporate and shareholder efficiencies; and financial risks.
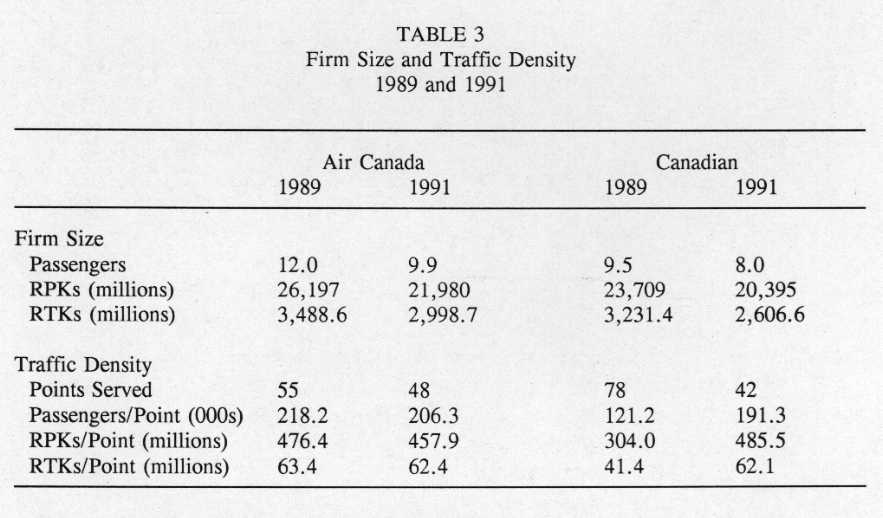
While economies of scale in the industry are negligible, the main advantages stemming from size come from the demand side. Consumers, for previously stated reasons, prefer large airlines and are willing to pay a premium for their services. Therefore the size of the airline is an important competitiveness consideration. From Table 3, depending on the indicator, Canadian is somewhere between 80% and 95% of the size of Air Canada. Canadian is: 81% of the size of Air Canada in terms of passengers carried; 93% of the size of Air Canada in terms of RPKs; and 87% of the size of Air Canada in terms of RTKs.
Sources: Air Canada and PWA Corporation, Annual Reports, 1989 and 1991.
In 1991, Air Canada offered scheduled services to 48 destinations: 17 domestic and 31 foreign. Seven destinations have been eliminated since 1989; yet, despite this network rationalization, depressed demand has brought about a decline in economies of traffic density. The numbers of passengers, RPKs and RTKs per destination have declined by 5.5%, 3.9% and 1.6%, respectively (see Table 3).
In contrast, Canadian offered scheduled services to 42 destinations in 1991: 17 domestic and 25 foreign. In 1989, when PWA acquired Wardair Inc., the number of destinations served by Canadian was 78. This rationalization, particularly domestic destinations, has permitted the airline to realize significant economies of traffic density. The numbers of passengers, RPKs and RTKs per destination have grown by 58%, 60% and 50%, respectively, in just two years. Consequently, Canadian has realized economies comparable to
those of Air Canada. In terms of passengers and RTKs per destination, Canadian trails Air Canada by 7.3% and 0.5%, respectively; but, in terms of RPKs per destination, Canadian has surpassed Air Canada by 6%.
B. Factor Productivities and Efficiencies
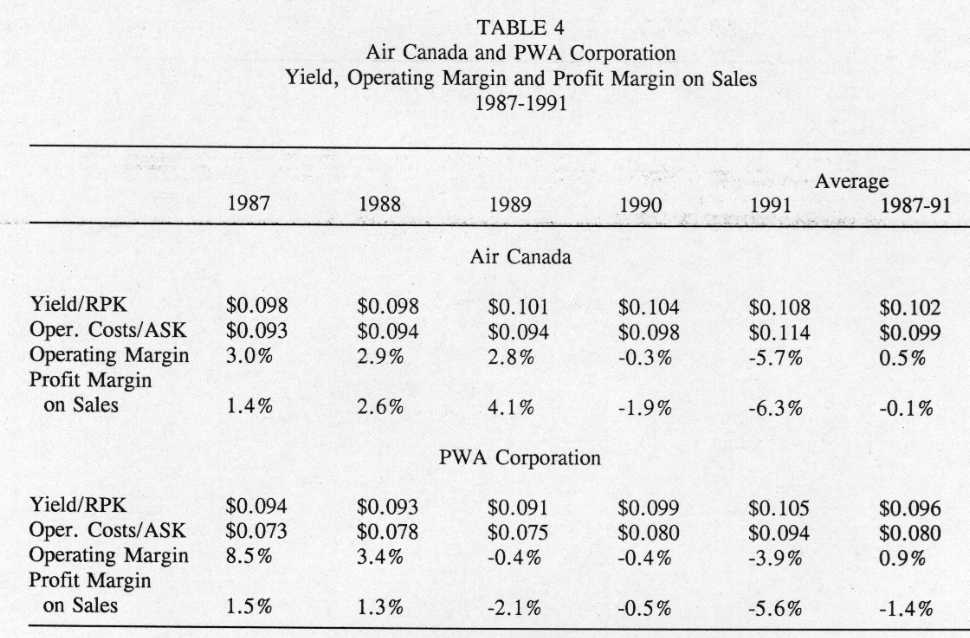
Since deregulation, the pricing strategies pursued by an airline have become crucial to success. In this respect, it appears that Air Canada has outperformed Canadian by about 5% over the past five years when evaluated in terms of yield per RPK. Operating costs per ASK at Air Canada have, however, been about 25% higher than at Canadian. Consequently, Canadian has significantly outperformed Air Canada in terms of operating margins over this period (see Table 4).
More specifically, Canadian's workers are more than 30% more productive than Air Canada's workers when measured in terms of physical output variables such as RTKs and ASKs per employee. In terms of operating revenue per employee, however, Canadian's workers are only about 4% more productive than Air Canada's workers (this discrepancy is attributable to Air Canada's better yield per RPK). Furthermore, Canadian employees receive less pay than Air Canada employees, by about 6% on average. As labour costs account for about 30% of an airline's overall operating expenses, Canadian's tighter control of labour costs largely explains its lower operating cost per ASK and greater operating margin relative to Air Canada.
Sources: Air Canada and PWA Corporation, Annual Reports, various years.
Air Canada, on the other hand, appears to have outperformed Canadian in terms of its capital and fuel costs. Air Canada is somewhere between 5% and 12% more efficient in terms of its capital costs when measured by passenger load factors and fixed asset turnover rates, respectively. Air Canada has also managed to buy its jet fuel at a 3% lower price than Canadian; and its fuel consumption per RTM is about 3% less, thereby making Air Canada's fleet about 6% more fuel efficient than Canadian's fleet (see Table 5).

Sources: Air Canada and PWA Corporation, Annual Reports, various years; Statistics Canada, Catalogue 51-206.
The disparity in operating costs, largely attributable to labour costs, is probably best rationalized by the dissimilar corporate philosophies of the two corporations and their organization since deregulation. PWA had originally chosen to undertake a significant but minority ownership position in each of its regional feeder airlines, thereby opting for decentralized management and cost control. In contrast, Air Canada chose to take majority positions in its affiliates from the outset, thereby opting to manage its feeder airlines directly. The results are unambiguous. In terms of controlling operating costs, the PWA organizational structure is superior. In the end, however, it is the bottom line that determines corporate success, not the operating margin.
In terms of profit margin on sales, Air Canada has outperformed Canadian (see Table 4). This somewhat paradoxical reversal of corporate fortunes is explained by the fact that Air Canada has deployed its fixed assets more wisely (compare the fixed asset turnover rates in Table 5). As noted previously, Air Canada has benefited from more significant economies of traffic density than has Canadian; and Canadian, especially since its acquisition of Wardair Inc., has been forced into more significant restructuring of its domestic route network than has Air Canada since deregulation. This network rationalization was made possible only because PWA has further invested in its regional feeder airlines to acquire majority control since 1990 (see Appendix 1C).
C. Corporate and Shareholder Efficiencies
In terms of corporate efficiency, as defined by net income divided by the capitalization of the firm (sometimes called total asset turnover rate), neither air carrier has fared well. The recession, the Persian Gulf Crisis and the introduction of the Goods and Services Tax are cited as the main culprits. Nonetheless, Air Canada has slightly outperformed PWA (see Table 6).
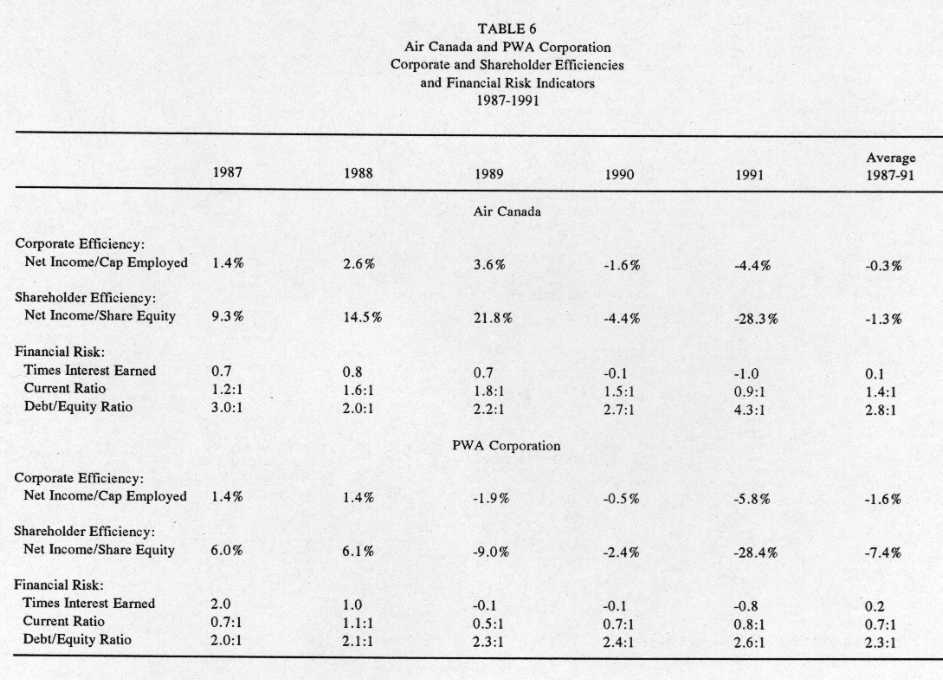
Sources: PWA Corporation and Air Canada, Annual Reports.
In terms of shareholder efficiency, again Air Canada has outperformed PWA in the past five years, but this time by a considerable margin. Moreover, Air Canada's superior performance was achieved while subjecting its shareholders to an equivalent amount of financial risk. Referring to the three indicators of financial risk: The "Times Interest Earned" for both companies was virtually the same (Times Interest Earned = pre-tax income before interest charges divided by interest charges). Air Canada incurred a slightly higher exposure to long-term debt relative to equity than Canadian, but the latter's current ratio (current assets to current liabilities) was significantly lower than Air Canada's.
D. Canadian vs. American Air Carrier Competitiveness
The preceding analyses provide interesting results to use in comparing Canadian and American airline companies. It was found that operating costs per output variable (either RTK, RPK or the number of passengers) and labour costs (as determined by wage rates and employee productivity) were not particularly useful in predicting which would be the more efficient air carrier.(16) In the end, the more efficient airline company was the one with the larger network, that benefited from more economies of traffic density, and that deployed its fleet more wisely. These findings provide a short cut in determining the relative competitiveness of North American air carriers by using the following formula:
Network Economies of Capital Firm
Size + Traffic Density + Efficiency = Efficiency
Many statistical indicators can serve as measures for each of the variables in this formula. The ones chosen here are: RTKs, RTKs per point served, Passenger Load Factors, and Return on Capital Employed. Table 7 summarizes these input and output statistics for the top 10 North American air carriers in 1990.
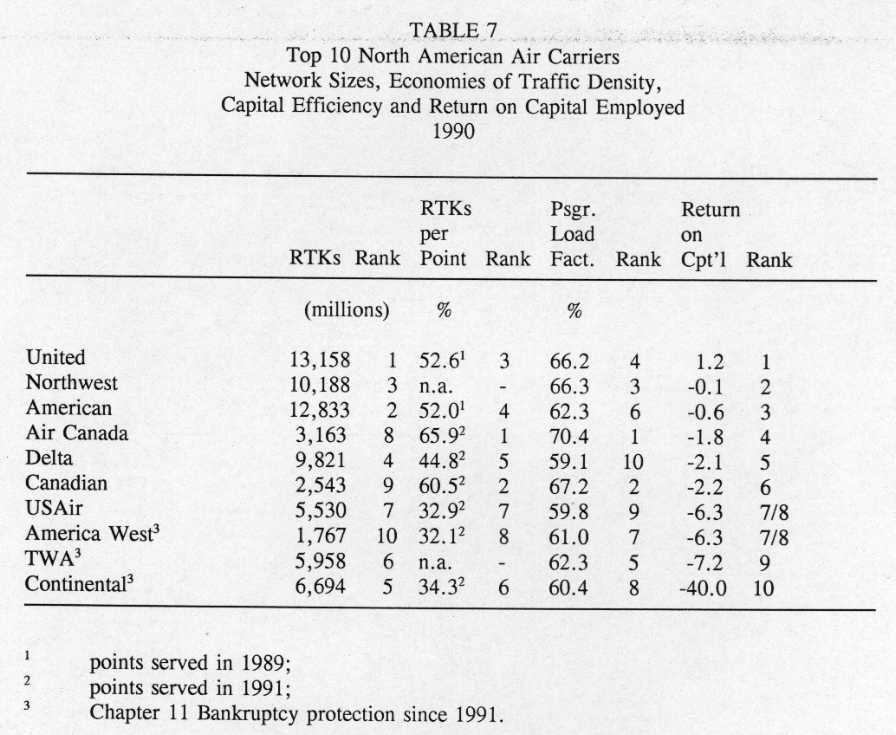
Sources: ICAO Statistical Yearbook, Civil Aviation Statistics of the World, 1990; Moody's Transportation Manual, 1992; T. Oum and M. Tretheway, 1991.
The comparison reveals that network size is an important determinant of firm efficiency. Those ranked the highest in terms of RTKs performed, by and large, were those ranked the highest in terms of return on capital. In fact, three of the four smaller major American airlines (America West, TWA and Continental) filed for bankruptcy protection in the subsequent year. Canadian, the smaller of Canada's two national airlines, required a merger and government assistance to remain solvent in 1992. The recession's next victim might be USAir, unless drastic corrective actions are taken, for example a merger with British Airways.
Economies of traffic density and passenger load factors, although they appear to be correlated, also shed light on the relative performances of the airlines. Northwest surpasses American, even though it has a smaller network, because it outperforms American in terms of passenger load factors. Air Canada and Canadian outperform their larger counterparts because they are ranked number one and two, respectively, in terms of RTKs per point served and passenger load factors.
Finally, over the 1987-1990 period a trend is noticeable, despite little change in relative rankings. United and Northwest are clearly numbers one and two. American and Air Canada have outperformed, and are now more efficient than, Delta. Delta and USAir are in decline, and the latter is in serious financial trouble.
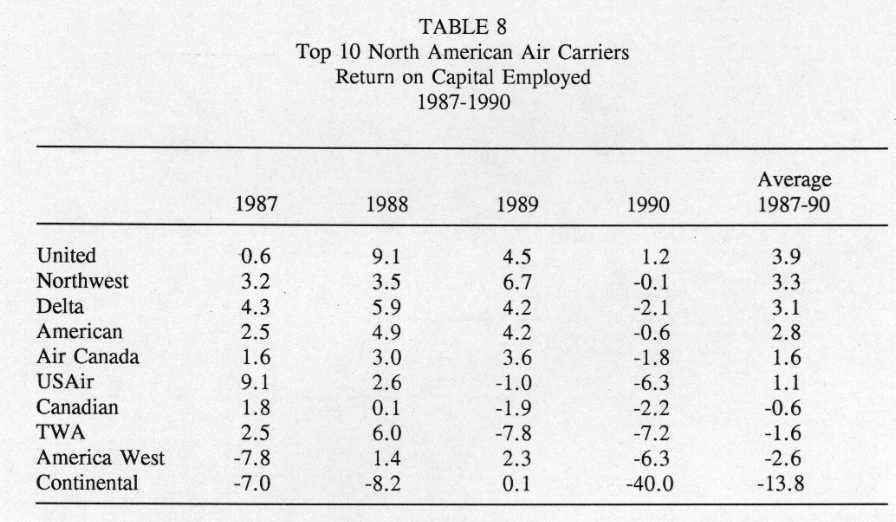
Source: ICAO Statistical Yearbook, Civil Aviation Statistics of the World 1989/90/91.
The Canadian airline industry is unique in that its market environment and cost structures have led to the development of a duopoly in scheduled services, with regional competitors in charter services. These factors have also contributed to the emergence of both a vertically integrated structure, which includes computer reservation and tourist agent services, and a horizontally integrated structure through mergers with regional and specialized local air carriers and strategic alliances with foreign air carriers. Finally, fares are a lot more complex, strategic and efficient than they were under regulation.
The demise of PWA in 1992 was imminent had it not been for the assistance of the Governments of Canada, Alberta and British Columbia. This was precisely because the airline's management did not fully understand the strategic nature of this duopolistic relationship. Whether or not Air Canada is guilty of predatory pricing, PWA should have maintained similar, and arguably higher, current and other liquidity ratios to remove any incentive for Air Canada to engage in such potentially destructive behaviour from the outset. PWA shareholders, creditors and employees have paid dearly for this oversight.
The management of PWA can also be faulted in other ways. The superiority of centralized management over its feeder airlines by the national carrier is well reflected in the corporate and shareholder efficiency statistics. Majority ownership has resulted in rational airline networks. Left to themselves, managers of feeder airlines will, as in the past, seek their own individual objectives and these at times may be counterproductive to the national air carrier. While decentralized management is often the preferred way of producing a lean and mean company in a head-to-head contest, as is confirmed by Canadian's low operating costs relative to Air Canada's, centralized management usually triumphs in more complex network contests. By 1990, PWA's management realized this fact and began to take majority stakes in its regional airlines. Unfortunately, PWA's management took at least an additional three years to recognize this fact.
The events that have led national air carriers to acquire majority ownership and control of their regional feeder airlines in Canada and elsewhere suggest the ultimate corporate design of the international industry in a completely deregulated market. Clearly, the scope of air transportation mode is global; and an increasingly deregulated, free trade environment will necessitate globally-integrated airline networks. Alliances, like minority ownership, are likely to prove insufficient for the most part. They appear to be only an interim solution in an increasingly deregulated international marketplace. Mergers of existing airlines to form multinational mega-carriers are the inevitable outcome of unfettered competition.
This is particularly relevant to Canada. Because of its relatively low, but high concentration of population along a very narrow band just north of its border with the United States, considerable pressure is being put on Canadian air carriers to develop efficient hub-and-spoke network configurations that include American cities. These cities' airports are already highly congested and terminal spaces are scarce, so that mergers are likely solutions.
As the comparison between Canadian and American air carriers suggests, network size is indeed an important efficiency consideration. Canadian air carriers are competitive with the major American air carriers only because of the foreign ownership restriction, in the absence of which an independent Air Canada and Canadian would not be possible in a deregulated international market environment.
Air Canada's bid to acquire Continental Airlines appears to be the first step in recognition of this fact. While Continental has a sufficiently large air network that includes badly-needed Pacific Rim markets, however, Air Canada would have the onerous task of reorganizing the airline.
AMR Corporation's offer to purchase 25% of the voting stock in Canadian would have 1,300 management and marketing jobs transferred from Calgary to Fort Worth, Texas and require PWA to abandon the Gemini Group for American Airlines' Sabre CRS; this appears to be the second step. American Airlines is compatible with Canadian and the purchase would probably result in a network superior to that made up of Air Canada and Continental.
Air Canada. Annual Report, 1989 and 1991.
Borenstein, S. "The Evolution of U.S. Airline Competition." Journal of Economic Perspectives, Vol. 6, No. 2, 1992, p. 45-73.
Consumer and Corporate Affairs Canada. Predatory Pricing Enforcement Guidelines. Director of Investigation and Research, Competition Act, 1992.
Gillen, D.W., W.T. Stanbury and M.W. Tretheway. "Duopoly in Canada's Airline Industry: Consequences and Policy Issues." Canadian Public Policy, Vol. XIV, 1988, p. 15-31.
Goldstein, J.L. "Single Firm Predatory Pricing in Antitrust Law: The Rose Acre Recoupment Test and the Search for an Appropriate Judicial Standard." Columbia Law Review, Vol. 91, p. 1757-1792.
ICAO Statistical Yearbook. Civil Aviation Statistics of the World, 1989, 1990, 1991.
Ministerial Task Force on International Air Policy. International Air Transportation: Competition and Regulation, Vol. I, 1991.
Mitchell, D. Canadian Air Transportation Services: A Quantitative Evaluation. Report prepared for the Ministerial Task Force on International Air Policy. July 1991.
Moody's. Transportation Manual 1992, 1992.
National Transportation Agency of Canada. Annual Review 1991. Government of Canada, Ottawa, 1992.
Oum, T. and M. Tretheway. Monopoly Versus Duopoly in Canada's Industry: Policy Alternatives and Consequences. Unpublished Manuscript. October 1991.
PWA Corporation. Annual Report, 1989 and 1991.
Statistics Canada. Catalogue 51-206. Canadian Civil Aviation, various years.
Tretheway, M.W. "Globalization of the Airline Industry and Implications for Canada." The Logistics and Transportation Review, Vol. 26, No. 4, December 1990, p. 357-367.
Tretheway, M.W. The Characteristics of Modern Post-Deregulation Air Transport. Report prepared for the Ministerial Task Force on International Air Policy. June 1991.
Western Transportation Advisory Council. "Canada's Air Industry: Developments and Issues since 1986." Westac Monitor, May 1992.
AIR CANADA AND PWA CORPORATION CORPORATE ORGANIZATIONS
1992
Source: National Transportation Agency of Canada, 1991 Annual Review.
1 owned by Canadian Regional Airlines Limited;
2 in 1992, Ontario Express, Canadian Frontier and Air Toronto merged to form one company;
Note: Others include turboprop and piston aircraft.
Source: National Transportation Agency of Canada, 1991 Annual Review.
PWA FINANCIAL RESTRUCTURING
1993
(1) Aviation Statistics Centre, Transportation Division, Statistics Canada.
(2) The volume of goods and people transported is expressed in terms of revenue tonne kilometres. This calculation was taken from the Report of the Ministerial Task Force on International Air Policy, International Air Transportation: Competition and Regulation, Vol. I, 1991, p. 44-46.
(3) Donna Mitchell, Canadian Air Transportation Services: A Quantitative Evaluation, Report prepared for the Ministerial Task Force on International Air Policy, July 1991, p. vii.
(4) Ministerial Task Force on International Air Policy (1991), p. 45.
(5) Ibid., p. 63.
(6) M.W. Tretheway, The Characteristics of Modern Post-Deregulation Air Transport, Report prepared for the Ministerial Task Force on International Air Policy, June 1991, p. 4-5.
(7) Ibid., p. 8.
(8) National Transportation Agency of Canada, Annual Review 1991, Government of Canada, Ottawa, 1992, p. 36.
(9) Tretheway (1991), p. 17-18.
(10) Ibid., p. 79.
(11) Ministerial Task Force on International Air Policy (1991), p. 52.
(12) Ibid., p. 54.
(13) Ibid., p. 120-121.
(14) S. Borenstein, "The Evolution of U.S. Airline Competition," Journal of Economic Perspectives, Vol. 6, No. 2, 1992, p. 51.
(15) One can also claim that pricing below average variable costs is legitimately competitive behaviour in depressed market conditions. In theory, marginal cost pricing is consistent with maximizing profits (or minimizing losses) even though it may involve pricing below average variable costs. Consequently, average variable costs, under these conditions, may be an unsatisfactory proxy for distinguishing predatory from competitive behaviour.
(16) Actually, the cost per Revenue Tonne Kilometre Available and the airline rankings in 1990 were as follows:
| US¢ | RANK | US¢ | RANK | ||
| Continental | 39.1 | 1 | American | 45.5 | 6 |
| America West | 40.0 | 2 | Delta | 47.0 | 7 |
| Northwest | 40.1 | 3 | United | 48.3 | 8 |
| TWA | 43.7 | 4 | Air Canada | 49.1 | 9 |
| Canadian | 45.1 | 5 | USAir | 60.3 | 10 |
These rankings show no correlation whatsoever with the return on capital rankings.