87-2E
FEDERAL SPENDING: CHANGING TRENDS
Prepared by:
Jean Soucy, Economics Division
Marion G. Wrobel, Senior Analyst
Revised 27 March 2000
TABLE
OF CONTENTS
B. Spending on Social Services
1. Old Age Security and Related Programs
4. Family Allowances/Child Tax Benefits
D. Federal
Budgets of 1990, 1991 and 1992 and
the December
1992 Economic Statement
FEDERAL SPENDING: CHANGING TRENDS*
Since 1970-71, total federal government expenditures have increased from $16,000 million to about $158,000 million. To put this in perspective, they went from 18% of Gross Domestic Product (GDP) in early 1970-71, to 15.8% of GDP in 2000-2001. These data, however, hide the fact that federal spending had grown to about 25% of GDP by the mid 1980s, from when it has declined (Figure 1).
The longer-term trend in spending originated many decades ago. This paper is concerned with only the more recent growth and explores not so much the aggregate level of expenditures as changes in the various components of spending. It will examine those components which account for total expenditure growth and explain why they do so.
The following three charts summarize trends in federal spending. Figure 1 looks at total spending as a proportion of GDP and provides a reference point by including revenues. We see a very pronounced trend to increased federal spending through the 1970s and first half of the 1980s. Since then, spending has fallen dramatically.
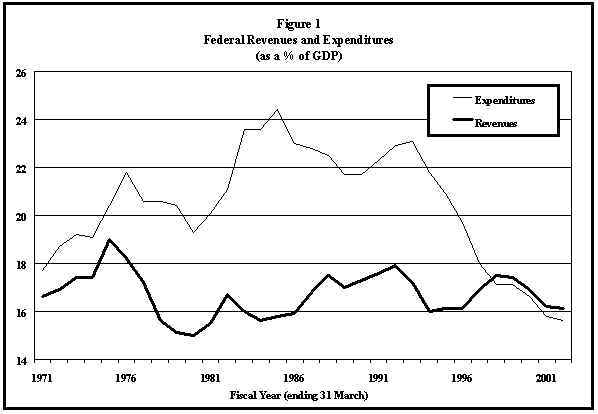
The chart clearly shows the effects of recessions on spending. Nevertheless, the first 15 years show a clear trend towards higher spending, which was reversed in the latter 17 years portrayed in the chart. Spending as a proportion of GDP is lower today than it was in the early 1970s.
While total spending has gone up and down, its composition has changed steadily. Since the mid 1970s, when the debt-to-GDP ratio reached its lowest level, the proportion of total spending accounted for by debt service charges has trebled, from 10% of total spending to about 30%. The budgetary projections suggest that debt service charges will stabilize at about 26% of spending, as can be seen in Figure 2.
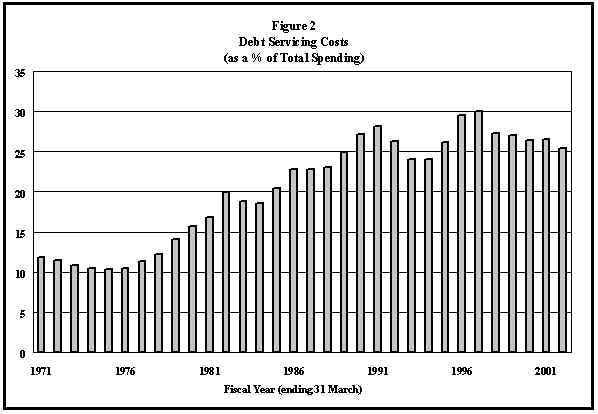
Figure 3 presents five major components of program spending and shows them as a proportion of total program spending. Trends over time for these categories give some indication of changes in government priorities. The chart shows a slow but steady move away from government funding of Crown corporations. There is a similar trend with respect to defence spending; the relative share of program spending devoted to defence has fallen by over 25% since 1990. Other departments and agencies account for an increasing share of spending, which should rise to 21.4% by fiscal year 2001-2002.
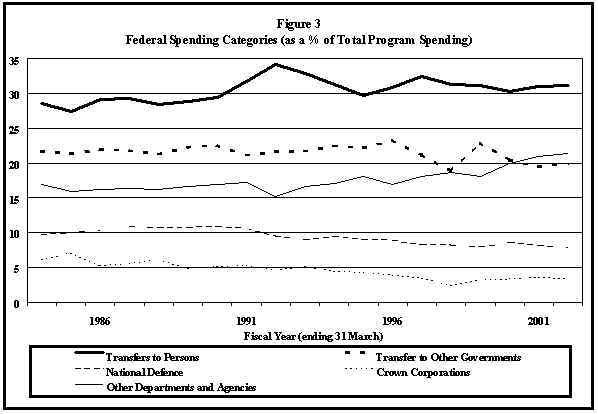
Transfers to other governments now constitute the third largest category of spending, according to this chart. Such transfers continued to have a relatively steady share of program spending until the introduction of the CHST. Since then, their share has declined; by fiscal year 2001-2002, it should account for just under 20% of program spending.
Transfers to persons are the most important component of federal spending, comprising just under 30% of program spending in the latter half of the 1980s. This grew to over 34% as a result of the recession and greatly increased Unemployment/Employment Insurance benefits. EI reforms caused the cost of benefits to fall somewhat so that transfers to persons should account for 31.1% of program spending by fiscal year 2001-2002.
The small increase in the relative importance of transfers to persons to the year 2002 is partly due to demographic changes causing steady growth in benefits to seniors. More important, however, the increase is due to the fact that these transfers were largely immune to the cutting applied to other programs. With the exception of EI reforms, which had their main effect prior to 1996, there have been no cuts to transfers to individuals in the latter half of the decade. Thus the relative importance of this category is growing slightly by default.
B. Spending on Social Services
In fiscal year 1986-87, the federal government spent $41,711 million on social services, as defined by Statistics Canada. The expenditures grew by 3.7% over the previous fiscal year. Over three years to 1986-87, social service expenditures increased by almost 20%. These expenditures constitute the major part of program spending and as such are a good subject for additional scrutiny. In addition, as a number of them were (and still are) subject to automatic indexation through much of the 1970s and early 1980s, they provide a convenient area to test the assertion that indexation has contributed to the rapid growth of government expenditures.
The two most significant programs are old age security payments and employment insurance. Gross expenditures on the OAS system are currently in the $24,200 million range and expenditures on EI amount to $11,500 million. Prior to reform of the Child Benefit System, the amounts spent on family allowances, though smaller, were also important.
Federal spending on social security in 1988 amounted to $45,335 million, compared to $4,497 million in 1970. Spending grew 14.6% faster than average in Newfoundland, while it grew about 14% less than average in Saskatchewan. In Ontario, spending increased 10% less than the national average. These provincial variations are due to differences in population growth, income growth and demographic change. As shown in Table 1, total government transfers for 1999 have considerably been increased. This increase is due to the $3.5 billion one-time supplement to the CHST announced as an immediate measure to help provincial governments with their health care programs. In 2000, another one-time supplement of $2.5 billion was announced.
1. Old Age Security and Related Programs
The Old Age Security (OAS) provides a universal taxable benefit to anyone over the age of 65 who meets certain residence requirements. This benefit is indexed quarterly to changes in the Consumer Price Index. It has been indexed, off and on, to the rate of inflation since 1971. The OAS is complemented by two other programs for the elderly: Guaranteed Income Supplement (GIS) and the Spouse's Allowance (SPA). These programs put to rest the myth that selectivity necessarily reduces program cost. Although the system has become more selective, it has also become more generous and thus more expensive.
After 1952, the system of old age pensions was completely universal; however, with the introduction of the GIS, it is becoming increasingly selective. This becomes clear if we consider the relationship between the maximum OAS and GIS rates. In 1971 the GIS maximum was 69% of the OAS payment. By 1987 it reached 119% of the OAS rate, where it remains today. Put another way, the OAS payments have stayed relatively constant since 1971; when measured in real dollars, they have increased by only 13%, while the maximum GIS rate has more than doubled.
TABLE 1
SOME FEDERAL SPENDING STATISTICS
(in million dollars)
|
Fiscal |
Total |
Program |
Gross |
National |
Transfers: |
Transfers: |
|
1970-71 |
15,998 |
14,111 |
1,887 |
1,818 |
3,281 |
2,954 |
|
1971-72 |
18,405 |
16,295 |
2,110 |
1,862 |
3,942 |
3,610 |
|
1972-73 |
21,107 |
18,807 |
2,300 |
1,937 |
5,153 |
4,134 |
|
1973-74 |
24,641 |
22,076 |
2,565 |
2,224 |
6,042 |
4,585 |
|
1974-75 |
31,476 |
28,238 |
3,238 |
2,526 |
7,620 |
5,884 |
|
1975-76 |
37,862 |
33,892 |
3,970 |
2,966 |
9,233 |
6,874 |
|
1976-77 |
41,304 |
36,596 |
4,708 |
3,373 |
9,873 |
8,399 |
|
1977-78 |
45,505 |
39,974 |
5,531 |
3,776 |
11,104 |
8,512 |
|
1978-79 |
50,004 |
42,980 |
7,024 |
4,096 |
12,030 |
9,551 |
|
1979-80 |
53,996 |
45,502 |
8,494 |
4,377 |
11,967 |
10,601 |
|
1980-81 |
63,423 |
52,765 |
10,658 |
5,063 |
13,793 |
11,578 |
|
1981-82 |
75,981 |
60,867 |
15,114 |
5,672 |
16,051 |
13,088 |
|
1982-83 |
89,711 |
72,808 |
16,903 |
6,599 |
21,697 |
14,177 |
|
1983-84 |
97,045 |
78,968 |
18,077 |
7,679 |
22,514 |
17,125 |
|
1984-85 |
109,493 |
87,100 |
22,393 |
8,636 |
23,888 |
18,548 |
|
1985-86 |
111,528 |
86,106 |
25,422 |
8,890 |
25,062 |
18,879 |
|
1986-87 |
116,673 |
90,005 |
26,668 |
9,695 |
26,423 |
19,569 |
|
1987-88 |
125,406 |
96,453 |
28,953 |
10,337 |
27,400 |
20,518 |
|
1988-89 |
132,840 |
99,688 |
33,152 |
10,700 |
28,780 |
22,145 |
|
1989-90 |
142,637 |
103,848 |
38,789 |
11,249 |
30,501 |
23,417 |
|
1990-91 |
151,353 |
108,765 |
42,588 |
11,518 |
34,532 |
22,928 |
|
1991-92 |
156,389 |
115,215 |
41,174 |
10,901 |
39,340 |
24,865 |
|
1992-93 |
161,401 |
122,576 |
38,825 |
10,939 |
40,365 |
26,544 |
|
1993-94 |
157,996 |
120,014 |
37,982 |
11,282 |
37,536 |
26,947 |
|
1994-95 |
160,785 |
118,739 |
42,046 |
10,693 |
35,326 |
26,313 |
|
1995-96 |
158,918 |
112,013 |
46,905 |
9,935 |
34,510 |
26,076 |
|
1996-97 |
149,793 |
104,820 |
44,973 |
8,661 |
33,986 |
22,162 |
|
1997-98 |
149,684 |
108,753 |
40,931 |
8,879 |
34,067 |
20,504 |
|
1998-99 |
152,787 |
111,393 |
41,394 |
8,781 |
34,665 |
25,523 |
|
1999-00 |
157,000 |
115,500 |
41,500 |
9,900 |
35,000 |
23,600 |
|
2000-01 |
158,000 |
116,000 |
42,000 |
9,400 |
36,000 |
22,600 |
|
2001-02 |
163,000 |
121,500 |
41,500 |
9,500 |
37,800 |
24,100 |
Source: Department of Finance, Fiscal Reference Tables, September 1999; and Minister of Finance, Budget Plan, February 2000.
From 1970 to 1988, total net payments for Old Age Security increased by a factor of approximately 5.7 while those for the Guaranteed Income Supplement increased by a factor of 12.5. The increase in total outlays is a function of two variables: annual payments per recipient and the number of recipients. It is clear that the major determinant of total OAS payments is the growth in recipient population. If we had kept the real value of benefits constant at 1970 levels, the total OAS bill in 1988 would have been $9,373 million rather than $10,774 million, a reduction of only 12.5%. This is not true of the GIS, for which the major cause of expenditure increases has been the growth in the real value of payments. If the real value of average GIS benefits had been held constant at their 1970 levels, total payments would have been $2,368 million in 1988, rather than $3,725 million, a reduction of 36%.
Why have real GIS payments grown so much and what are their component parts? Does the growth of GIS payments reflect an increasing incidence of poverty among the elderly or does it rather represent an increasing generosity on the part of the federal government? There are several ways of looking at these questions. The growth in the number of GIS beneficiaries has been only slightly higher than the growth in the number of OAS beneficiaries. Interestingly, though, the number of recipients receiving the full benefit has steadily declined, while the number receiving a partial benefit has grown to three times its 1970 number.
The GIS was actually viewed as a temporary measure when it was introduced. That was the period when the Canada Pension Plan (CPP) came into existence. The GIS was intended to help those who did not or could not participate in the CPP. As CPP participation increased, however, the need for the GIS was to diminish. Although the number of recipients of full benefits has declined as CPP participation has increased, the number of recipients of partial benefits has increased. One explanation for this is the nature of the tax back regime. Income other than OAS payments is taxed back at a rate of 50%. The point at which partial benefits cease to exist is when income is equal to two times the level of GIS maximum benefits. This cut off point grows with the GIS. The government has decided in the past that the GIS maximum should grow in real terms and it has used ad hoc increases to achieve this. (The GIS is also fully indexed to CPI changes.) This means that the cut off point has also grown in real terms. As a result a greater proportion of the elderly population has become eligible for partial GIS payments.
To put the discussion of OAS and GIS in perspective, we can look at their relative shares of GDP. In 1970, OAS payments accounted for 1.8% of GDP. This ratio fell to 1.6% and remained at that level until 1982 when it reverted to 1.8%, where it has stayed. Because OAS benefits have increased only slightly in real terms over this period, real GDP growth was able to offset the increase in the OAS eligible population. The pattern for the GIS is quite different. In 1970, GIS payments represented 0.3% of GDP. This ratio increased to 0.5% in 1971 and remained at that level for ten years. In 1981 it increased to 0.6% of GDP and in 1985 was at 0.7%. GIS maximum benefits have increased substantially in real terms, and because of the nature of the tax back mechanism, the eligible population has also increased. Thus a program which was initially viewed as temporary has more than doubled in relation to the size of the economy.
As the government sought to control its spending in order to reduce the deficit, the 1996 budget announced the introduction of a new Seniors’ Benefit that was to begin in 2001. It was to be a targeted and tax-free benefit aimed at elderly families, and indexed fully to inflation. Eligibility and the size of benefit were to be based upon family income. Once the new Seniors’ Benefit came into existence, the OAS, GIS, Age Credit and Pension Income Credit would have disappeared.
The proposed benefit attracted considerable criticism, mostly on the grounds that certain provisions would have reduced the incentive for those in some income categories to save for retirement. The proposal was withdrawn. The government now argues that, with its fiscal house in order, the need for dramatic reform is lessened.
Total Employment Insurance (EI) benefits are today in the neighbourhood of $12,000 million annually. These benefits totalled less than $550 million in fiscal year (FY) 1970 and reached a high of $19,065 million in 1992-93. A comparison of these dollar amounts over more than two decades suffers from the same problems that plague all such comparisons: changes in the relevant price index and scale of the economy distort the magnitude of the differences. Nevertheless, the growth in EI benefits is not an illusion. In the late 1960s they equalled 0.56% of GDP, whereas since 1982 they have exceeded 2% of GDP. Today they are closer to 1.4% of GDP. We cannot appeal to inflation or increases in the absolute numbers of unemployed to explain this growth.
The obvious variable to consider when explaining the ratio of EI benefits to GDP is the unemployment rate. But this alone is not responsible. The unemployment rate since 1982 has been 2.7 times the average rate of that of the late 1960s, but the ratio of EI benefits to GDP is 4 times higher. Something else has happened to make the unemployment insurance system as expensive as it is.
Two institutional changes help to explain the growth. In 1971 the system was significantly liberalized. This increased benefit levels and made them taxable; it loosened eligibility requirements; it increased both the duration of benefits and increased overall coverage. It is estimated here, that this institutional change increased the ratio of EI benefits to GDP by 0.56 percentage points for every level of the unemployment rate. In addition to this direct effect, the institutional change increased the cost of the EI program to the extent that it increased the rate of unemployment. Estimates of this EI-induced unemployment range from 0.4 to 1.9 percentage points.
In 1978, the unemployment insurance system was tightened up in light of dissatisfaction with some aspects of the 1971 reforms. It is apparent that these new changes were successful: even though the average unemployment rate increased after 1978, the ratio of EI benefits to GDP actually fell. It is estimated here, however, that the 1978 changes countered only about one-half of the 1971 changes. Thus the present system is still more generous than the one in existence prior to 1971.
The recent cost of the EI system is mostly the result of the high rates of unemployment that started with the recession, though they have since fallen. The benefit/GDP ratio varies approximately 0.5 percentage points for every 3 percentage point change in the unemployment rate. The decline in unemployment slowed down considerably in the early 1990s. The rapid decline in EI benefits is due to reforms that tightened up the eligibility and benefit rules.
What is clear, nevertheless, is the sensitivity of the size of the program to institutional change. Such change has a major and rapid effect on the size of the EI program. For example, implementing the recommendations of the Forget Commission could have the same effect on program cost as a three percentage point drop in the unemployment rate.
The federal government introduced Bill C-21 in June 1989 in an attempt to reduce the disincentive effects of unemployment insurance and to reduce federal expenditures in this field. This bill imposed stricter entrance requirements for EI benefits, reduced the duration of those benefits on average, and withdrew federal government financial contributions to this program. It is expected these proposed measures will save the government $1,900 million annually.
The Liberal government of Prime Minister Chrétien initiated unemployment insurance reform early in its mandate, looking to reduce program spending by close to $1,000 million per year. Legislation for the new Employment Insurance Program received Royal Assent on 20 June 1996. It reduced maximum benefits, and reduced benefits somewhat to repeat users as well as generally tightening up the system. First announced in the Speech from the Throne, the extension of parental leave from six months to one year was included in Budget 2000.
4. Family Allowances/Child Tax Benefits
The historical pattern of family allowance expenditures is relevant to this discussion for a number of reasons. In the first place, family allowances were an important component of federal spending on social development. By 1991, net family allowance payments amounted to about $2,800 million and were delivered to over 3.7 million families. But this program is also interesting in that it demonstrates how expenditure patterns can be totally misleading. Changes in the design of the program since 1970 make it difficult to discuss trends. The program started out as a modest non-taxable benefit available without regard to income. It then became a taxable benefit in 1974 and was substantially increased. In 1979, the level was reduced and a Child Tax Credit (CTC) introduced.
The number of children for whom family allowances are delivered, peaked in 1975 at 7.3 million.
In 1970, family allowance payments amounted to 0.6% of GDP. This increased to 1.2% in 1974 as a result of the big increase in gross benefits per child. The ratio of payments to GDP declined to 0.9% over the next four years and then further declined to 0.6%. This was mostly the result of the decrease in the number of eligible children and the 1979 reduction when the CTC was introduced.
The Child Tax Credit was technically considered to be a tax expenditure and as such did not show up in expenditure or revenue figures. But such an exclusion is purely arbitrary and the CTC could just as easily have been considered as an expenditure with "tax back" provisions like the GIS. If we treat it as such and combine it with the family allowance, the pattern of child expenditures is as follows: from 0.6% of GDP in 1970, these expenditures increased to 1.2% in the mid-1970s when the number of children peaked; the ratio then declined slightly, only to jump up again to 1.3% with the introduction of the CTC; finally, it fell to its 1990s level of 0.9% of GDP as a consequence of a further decline in the client population.
The April 1989 federal budget introduced a benefit reduction scheme which applied to Old Age Pensions and Family Allowance Payments, taxing both through the personal income tax system. Benefits were reduced by $0.15 for every dollar of individual income in excess of $50,000. The Family Allowance Program no longer exists, having been replaced by the Child Tax Benefit as of 1 January 1993. Transfers to persons, which are now near record levels, would have been even higher in the absence of this reform. The 1996 budget proposed to double the working income supplement in two stages, to $1,000. This has now been changed. The government is adding an additional $600 million to the program and basing the supplement on the number of children in a family. The 1999 budget announced increases in CTB amounts: $320 million starting in July 1999, followed by another $750 million in 2000 and $850 million in 2001. Budget 2000 announced further increases: $475 million starting in July 2000, followed by $1,020 million in 2001 and $1,350 million in 2002.
The discussion above has dealt with various program expenditures of the federal government. A large and growing component of government spending, however, is interest charges on accumulated government debt. In 1970 these charges amounted to $1,800 million whereas they could reach $40,000 million this fiscal year. As a percentage of GDP, they have more than doubled, to almost 6%.
It is popular to blame this component of expenditure on monetary policy rather than fiscal policy, citing the role of high real interest rates since 1982-83. Debt charges could be reduced substantially by a policy designed to reduce prevailing interest rates, it is argued. For example, at the time of the release of the 1988 Main Estimates, it was claimed that a one percentage point drop in interest rates could reduce debt payments by $1.4 billion.
It is true that real interest rates are today much higher than they were in the 1970s. But during that period we experienced accelerating inflation which left ex post real interest rates often at very low, even negative levels. The desirability of repeating such an experience is not at all obvious. It is not at all clear that the Bank of Canada could reduce real interest rates through a policy of monetary expansion. Nor is it obvious that all of today's high debt charges can be blamed solely on high interest rates. There is another important variable to consider; namely, the stock of debt to which these interest charges are applied.
In the first half of the 1970s, debt charges averaged 2.2% of GDP. This was associated with a falling debt to GDP ratio and low, often negative, real interest rates. After 1976, debt charges rose steadily to over 4% of GDP even though real interest rates continued to be relatively low. This was because the stock of debt was growing. The debt to GDP ratio grew over this period as the federal government started to run considerable deficits.
Starting in 1984, debt charges exceeded 5% of GDP. During this time, while the stock of debt grew rapidly, real interest rates were extremely high by recent standards. It is this factor which has led some analysts to argue that high debt charges are a matter for monetary policy.
To test this assertion we estimated the effect on debt charges of a 3% real interest rate, starting in fiscal year 1982. Although a 3% real rate is still high by the standards of the 1970s, when real rates of interest were unusually low, it is compatible with the long run interest rate experienced in Canada.
The average ratio of debt charges to GDP since fiscal 1982 has been 4.8%. With a 3% real interest rate this ratio would have fallen to 3.64% on average. The debt to GDP ratio would have fallen marginally as well, from 59.47% to 57.4% at the end of 1986-87. The average ratio of debt charges to GDP would, however, still have been significantly higher than anything experienced in the 1970s. The impact of such a lowering of interest rates on the size of the debt and corresponding debt charges has been overestimated. That action limits the ratio of gross debt charges to gross public debt, as published by the Department of Finance, to 3% in real terms. But a policy which lowered interest rates today would affect only new borrowing. It would be several years before a sustained drop in interest rates affected the entire stock of outstanding debt.
D. Federal
Budgets of 1990, 1991 and 1992 and
the December
1992 Economic Statement
On 20 February 1990, the Hon. Michael H. Wilson tabled his sixth budget. The highlight of this budget was an expenditure control plan, designed to reduce total spending by $6,111 million over two years and $16,689 million over the next five years. This plan contained four elements. First, a number of programs, most notably Canada Assistance Plan payments to Ontario, British Columbia and Alberta, were to grow by no more than 5% per annum over the next two years. Second, Established Programs Financing were frozen on a per capita basis for two years. Third, some programs were reduced, including spending on social housing, Health and Welfare and Secretary of State grants. Finally, some programs were eliminated - these include the Canadian Exploration Incentives Program, the OSLO oil sands project and the Polar 8 Icebreaker. These measures were expected to reduce program spending to 14.2% of GDP by 1994-95.
The main thrust of the 1991 budget was to extend by three years the expenditure control plan introduced the year earlier. Forming part of this plan were a wage restraint program for the Public Service of Canada and legislated limits on program spending.
The program spending restraint legislation set out in the budget was a hybrid of the American Gramm-Rudman deficit control limits and sunset legislation used at the American state government level to control the growth of government programs. The budgetary proposal limits total program spending from 1991-92 to 1995-96 to $615,300 million. The limits for each year were to grow by an average of 3% per year. This measure was intended to limit overall spending, so that any excess in one year would not be added to the expenditure base but would have to be offset in other years.
The 1992 budget extended the Expenditure Control Plan even further as well as cutting $1,000 million from 1992 spending. The poor performance of the Canadian economy had put further pressure on the federal deficit, mainly through revenue reductions but also because of some program spending increases. In response to these developments, the government took further initiatives to curb and control the cost of government operations by $ 3,600 million over a two-year period. Some of these new measures included a 10% reduction in most grants and subsidies in each of the next two years, a further two-year wage freeze for public servants and politicians, and a 3% reduction in operating budgets. In addition, the EI benefit rate for new beneficiaries was reduced from 60% of insurable wages to 57%. Those who quit their jobs without just cause, or who were fired, lost eligibility for EI.
This budget added a few new elements of spending control to those announced in past budgets and in the economic statement. The new measures, though, were small in comparison with earlier moves.
Grants and contributions, which had been cut by 10% for two years, were to be cut by 20% after 1996-97. Reductions to regional development programs were also extended and some federal-provincial development agreements were not renewed. Where previous restraint measures had allowed for future increases, those increases were now limited to 1.5% per year, the expected rate of inflation. This applied to defence spending, international assistance, and the funding of university research councils.
CMHC funding for social housing was frozen at $2,000 million per year, while funding for the CBC and VIA Rail was to be cut by $100 million per year after 1995-96. An additional $300 million was to be taken from operating budgets in 1993-94 and 1994-95, with larger cuts thereafter. All in all, though, these additional cuts would have their greatest impact several years in the future.
Despite all these cuts, government operations increased from $17,150 million in 1991-92 to $20,300 million in 1993-94, an 18.4% increase over two years.
Program spending was expected to increase, according to this budget, by 1.7% per year from 1993-94 to 1997-98. This was just slightly above the rate of inflation. In the short term, however, the growth in program spending was higher, masked by restructuring of child benefits. Program spending in this year was expected to be 2.8% higher than in 1992-93, with the following year's growth almost as high, at 2.6%.
This budget met the requirements of the Spending Control Act. In fact, cumulative spending to 1995-96 was expected to be $8,500 million less than allowable limits and the government proposed that this underspending be incorporated in new, lower limits. These spending limits were adjusted to account for the restructuring of federal programs which moved some obligations out of the realm of program spending.
This budget projected stable program spending to 1995-96. Any growth in total spending would be the result of higher debt servicing costs.
This apparent stability in program spending was due to the reforms put in place with respect to the system of child benefits. Without these reforms, expenditures would have grown; instead, tax revenue was expected to decline.
From 1990 to 1993, federal spending grew at a faster pace than revenues. By 1995, this was changing. After 1994-95, program spending was expected to decline every year; by 1997 it would be $12,000 million less than in 1993-94, when it totalled $120,000 million. As a proportion of GDP, program spending, including restructuring charges, was expected to decline from 16.9% to 13.1%. While program spending was declining, however, public debt charges were slated to increase substantially. By 1996-97, they were expected to exceed $50,000 million (6.2% of GDP), compared to $38,000 million (5.3% of GDP) in 1993-94.
The government was able to control spending on account of a major review and reduction in program expenditures and government operating costs that were expected to result in a 45,000-person decline in federal employment. Approximately 6,000 of the positions were expected to be transferred to the private sector, while the remaining positions would disappear.
As part of these cuts, business subsidies were to be reduced by 60% over three years and certain agricultural subsidies were to be reduced or eliminated altogether. Program review in departments that had been reviewed, (a 19% decrease) were expected to result in spending levels in 1997-98 almost $10,000 million less than in 1994-95.
In addition, the government planned to combine the Canada Assistance Plan and Established Programs Financing transfers into one block grant, starting in 1996-97. This "Canada Social Transfer" would be based on a new formula resulting in a total of $4,700 million in reduced transfers for 1996-97 and 1997-98. Provinces were to have more say as to how they spent these funds, while federal transfers would no longer be linked to provincial spending decisions.
The government's spending projections also factored in a reform of unemployment insurance, which was expected to save at least $700 million in 1996-97. Some small changes were made to the Old Age Security system, with the promise of much more to come following a review by the Minister of Human Resources Development.
The 1995 federal budget announced $25,300 million in cumulative expenditure cuts over a three-year period ending in 1997-98, with $17,000 million due to program review. Only 16% of these cuts, however, were to take place in the first year.
This budget, unlike the 1995 budget, did not introduce significant spending cuts. It did, however, ensure that program spending would continue to fall, to $105,500 million in 1998-99. This was in contrast to program spending of $118,700 million in 1994-95.
The budget extended Program Review, saving an additional $1,900 million in 1998-99. Some of the major new announcements in the budget included a further 3.5% reduction in departmental budgets in 1998-99, a phasing out of the dairy subsidy, an 18% reduction in the postal subsidy, lower spending on VIA Rail and AECL, and more cuts to defence. Some of these savings were re-allocated to other areas of greater priority.
This budget introduced a number of new spending initiatives in priority areas. The overall impact was small, and program spending continued on the downward track established in earlier budgets.
New initiatives to promote job growth included a $425-million top-up to the Canada Infrastructure Works Program for 1997-98 (announced prior to the budget), and an $800-million contribution in 1996-97 for the Canada Foundation for Innovation. The Foundation was to finance a five-year infrastructure modernization initiative for colleges and universities, research hospitals and not-for-profit research institutes. Financing contributions by the Foundation would not have to exceed 50% of any capital project’s costs and were generally to be kept at about 40% of the total. Although the government’s contribution was included in 1996-97 expenditures, funds were not to be disbursed for capital projects until later. The Auditor General expressed some qualms about the government’s way of accounting for this expenditure, in much the same way as he had questioned the previous year’s budget accounting of the payment made to the three Atlantic provinces in relation to the Harmonized Sales Tax.
Additional funding was also provided for the Networks of Centres of Excellence, the Industrial Research Assistance Program (IRAP), an extension of the Residential Rehabilitation Assistance Program (RRAP), and additional funding for tourism promotion. These additions to program spending were small and were not expected to affect the downward trend in overall program spending, which by 1998-99, at $103,500 million, was predicted would be just under 12% of GDP. The budget also announced capital injections of $50 million each to the Business Development Bank and the Farm Credit Corporation. While these injections required financing from the federal government, they did not constitute spending initiatives, since the government balance sheet would show an associated asset.
The government also benefited from low interest rates. It was expected that, by 1998-99, public debt charges, at $46,500 million, would equal 5.3% of GDP, down from 6% of GDP in 1995-96.
This budget continued the trend to reduce federal spending. It was planned that, as a proportion of GDP, total federal spending in 1999-00 would be 30% less than it was in 1992-93 and exactly one-third less than it was in 1984-85, when it reached a peak of 24.6% of GDP. As can be seen from Figure 1, however, the pace of decline was slowing down.
Program spending was expected to equal 11.5% of GDP by 1999-00. This is in contrast to 17.8% of GDP in 1992-93, and 19.6% in 1984-85. This measure of federal spending showed even more dramatic declines, a 35% decline since 1992-93 and a 41% decline since 1984-85. Indeed, the nominal dollar value of total and program spending in 1999-00 was projected to be about the same as in 1990-91, nine years earlier. This was also an unprecedented achievement.
Still, the 1998 budget introduced a number of new spending initiatives that, when added to measures announced before the budget, added up to $10,900 million in cumulative new spending to the year 1999-00. Adding the increased Child Tax Benefit spending listed by the budget as tax relief was expected to generate $12,000 million in cumulative new spending over four years.
The largest single spending initiative was the Canada Millennium Scholarship program. The government was debiting $2,500 million for this program in 1997-98, even though it had not actually forwarded the funds to the foundation until 1998. The cumulative cost of the increase in the CHST cash floor ($12,500 million), which was announced prior to the budget, was to be $4,100 million to the year 1999-00. Other spending initiatives were directed to post-secondary students, and complemented the new tax measures.
Also announced in the budget were enhanced funding for the granting councils, additional funds for Aboriginal programs, and money for AIDS initiatives.
After the previous year’s budgetary surplus, the government faced substantial demands for greater social spending, primarily on the health care system. Several initiatives were announced in that sector. Over the following five years, $11,500 million were to be transferred to the provinces, exclusively for their health care systems. Of this amount, $8,000 million would increase the CHST cash floor and $3,500 million would be an immediate one-time supplement to the CHST.
Even with this announcement, federal spending in year 2000-01 was expected to be at its lowest level in 50 years, accounting for 12.0% of GDP — 0.6% percentage points lower than was expected for 1999-2000.
Initiatives with respect to knowledge and innovation were also announced in this budget. The Canada Foundation for Innovation, whose main objective is the promotion of research in the high-technology sector, was to receive additional funding. For the first time in its history, the Canadian Space Agency was promised substantial non-project related support from the federal government; $430 million was to be invested over the next three years.
The Child Tax Benefit had already been increased in the 1998 budget; however, the 1999 budget extended these benefits to modest- and middle-income families by dedicating $300 million to them. EI premiums were also to be reduced by a total amount of $465 million in 1999-2000. In brief, the 1999 budget emphasized the health care system, while providing all taxpayers with a small tax reduction.
The budgetary surplus in 1998-99 was the second in a row. After announcing in Economic and Fiscal Update 1999 that there would be large surpluses over the next five years, the government introduced a tax-cutting plan in Budget 2000. Nevertheless, the federal government also introduced new spending initiatives: $900 million of additional funding to the Canada Foundation for Innovation, $900 million over five years to create 2,000 new university research chairs across Canada, $160 million to Genome Canada to advance the study of genes and biotechnology, $700 million over four years to improve environmental technologies and practices, and additional funding for infrastructure projects to be negotiated with provincial and municipal governments.
The CHST was increased by an additional $2,500 million in a one-time payment in fiscal year 1999-2000.
After many years of budget cuts, funding for defence started to rise again in 1998-99. Substantial additional funding was announced in Budget 2000: an increase of $634 million in 1999-2000, $546 million in 2000-2001 and more than $500 million in every subsequent year. Other departments and agencies were given increases in their funding for operating and capital purposes, for a total of $505 million in 1999-2000 and $1.2 billion the following year. Nevertheless, project spending as a percentage of GDP is still projected to decline to 11.6%.
The most important element in Budget 2000 is the restoration of full indexation for tax brackets and tax credits, an initiative also extended to the Child Tax Benefit.
In a very real sense, the history of government expenditures is the result of parliamentary action in one form or another. Approximately once a year, the Minister of Finance presents a budget to Parliament in which the government's future spending and taxation plans are outlined. In addition, almost every bill passed in Parliament has some impact on government expenditures.
June 1971 - The EI system was substantially expanded and liberalized with the passage of Bill C-229.
January 1974 - Family allowance payment was increased to $20 per month per child and began to be treated as taxable income. The monthly payment also became subject to indexation.
1977 - Bill C-27 was introduced and passed in 1977 to tighten up the liberalized EI system. It increased eligibility requirements and reduced maximum weeks of benefits for a wide range of EI recipients.
1978 - Child Tax Credit was introduced. Maximum benefit was set at $200 per eligible child.
1979 - Family allowance benefits were reduced by about 22% starting in January.
1983 and 1984 - Indexation factors for government expenditures were limited to 6% and 5% respectively.
May 1985 - The federal budget proposed limiting indexation to CPI changes in excess of 3 percentage points.
November 1986 - The Commission of Inquiry on Unemployment Insurance (C.E. Forget, Chairman) released its Report calling for major changes to the EI system in order to return the program to its insurance function.
October 1994 - The Minister of Finance, the Honourable Paul Martin, published the Economic and Fiscal Update.
December 1994 - The House of Commons Standing Committee on Finance tabled its report "Confronting Canada's Deficit Crisis."
November 1999 - The Minister of Finance, the Honourable Paul Martin, in his presentation of the Economic and Fiscal Update, forecast continuing budgetary surpluses along with moderate growth in expenditures.
Bird, R.M. The Growth of Government Spending in Canada. Canadian Tax Papers No. 51. Canadian Tax Foundation, Toronto, July 1970.
Canada, Department of Finance. The Fiscal (Budget) Plan. Ottawa, various dates.
Dingledine, G. A Chronology of Response, The Evolution of Unemployment Insurance from 1940 to 1980. Employment and Immigration Canada, Ottawa, 1981.
Gauthier, Gilles. Federal Public Expenditures Part I: Growth. BP 119-E, Research Branch, Library of Parliament, Ottawa.
Horry, I.D. and M.A. Walker. Government Spending Facts. The Fraser Institute, Vancouver, 1990.
Prince, M.J. How Ottawa Spends, 1986-87: Tracking the Tories. Methuen, Toronto, 1986.
Saunders, P. and F. Klau. "The Role of the Public Sector." OECD Economic Studies, No. 4, Spring 1985.
The National Finances. Canadian Tax Foundation, Toronto, various issues.
* The original version of this Current Issue Review was published in January 1987; the paper has been regularly updated since that time.