89-1E
LABOUR MARKET DEVELOPMENTS
Prepared by:
Kevin B. Kerr
Economics Division
Revised 28 July 2000
TABLE
OF CONTENTS
D. Quarterly Review (2nd Quarter 2000)
LABOUR MARKET DEVELOPMENTS*
Labour, the most widely used and valued input in Canadian production, is exchanged in a market best described as being in a constant state of flux. According to the most recent data available, each year throughout the period 1990-1993 an average of 3.49 million workers were temporarily laid off and 2.5 million were hired. Contrary to the widely held belief that economic structural changes have increased the incidence of permanent layoffs, the average risk of a permanent layoff in the early 1990s was similar to that in earlier periods at the same point in the business cycle (see G. Picot and Z. Lin, "Are Canadians More Likely to Lose Their Jobs in the 1990s?", Canadian Economic Observer, September 1997).
Conditions in this market throughout the last decade and the beginning of the 1990s were influenced by a number of factors, including two major recessions, growth in non-standard employment, rising skill requirements and an increase in the incidence of long-term unemployment. These, and other developments in the labour market that have occurred since the beginning of the last decade, are the subject of this review.
The demand and supply of labour in this country is measured officially by Statistics Canada in its monthly Labour Force Survey, which involves approximately 52,000 representative households across the country. This survey is usually conducted during the week containing the 15th day (also known as the reference week). Although the survey is intended to represent the population 15 years of age and over, individuals residing in the Yukon and Northwest Territories, residents of Indian reserves, full-time members of the Armed Forces and people living in institutions are excluded. The supply of labour is measured by the size of the labour force, including both employed and unemployed individuals. The demand for labour is represented by the employed component of the labour force.
The survey defines as employed those who, during the reference week: did any work at all (work is defined as any work for pay or profit conducted under an employer/employee relationship); were self-employed (this includes those who did unpaid work related to a family farm, or a business or professional practice owned or operated by a family member); or had a job but were unable to work because of sickness, family responsibilities, bad weather, labour dispute, vacation or some other reason (not including waiting to be recalled or planning to start work in the near future). It should be noted that this definition of "employed" does not distinguish between various amounts of time spent working and thus affords equal weight to full-time and part-time employment.
The survey defines as unemployed those who, during the reference week: were without work, able to work and had been looking for work in the past four weeks (including full-time students looking for part-time work provided they do not report an unacceptable reason for not taking a job); or were waiting to be recalled from a layoff or expecting to start a new job in four weeks or less. The survey thus generates data which present a static picture of the labour market. It does not provide us with a dynamic perspective which, in any given month, would differentiate between individuals who, for example, were employed all month, unemployed all month, employed for part of the month and unemployed for the rest of the month, were not in the labour force for part of the month but employed for the rest of the month and so on.
Compared to the previous decade, labour force growth in the 1990s has increasingly relied on net immigration. Between 1991 and 1995, it is estimated that net immigration contributed 1.5 times more to labour force growth than that witnessed throughout the latter half of the 1980s (see F. Denton and B. Spencer, "Population, Labour Force and Long-term Economic Growth," Policy Options, January-February 1998). In addition, labour force growth in the 1990s was considerably slower than in the previous decade, mainly as a result of a decline in labour force participation. Throughout the period 1990-1999, the aggregate participation rate declined by 1.5 percentage points. Underlying this trend is the steady decline in labour force participation among workers 15-24 years of age and workers 55 years of age and more. As illustrated in Chart 1, the drop in the youth participation rate commenced just prior to the onset of the 1990-91 recession. Since reaching a peak of 70.6% in 1989, the youth participation rate declined steadily to 61.5% in 1997, rising to 63.5% in 1999. While it is tempting to attribute this trend exclusively to cyclical factors, there appears to be more than a discouraged worker effect (i.e., unemployed individuals withdrawing from the labour market because they believe that no jobs are available) underlying this trend. According to a recent study, more than two-fifths of the decline in the youth participation rate is attributed to an increase in school enrolment (see Applied Research Bulletin, Human Resources Development Canada, Vol. 3, No. 2, Summer-Fall 1997). Between 1989 and 1996, the proportion of 15 to 24 year olds attending school increased by 8.8 percentage points to 56.5%, an upward trend that is only partially attributed to cyclical factors. Hence, even as the economy continues to grow, we can expect the youth participation rate to remain below that witnessed before the turn of the decade.
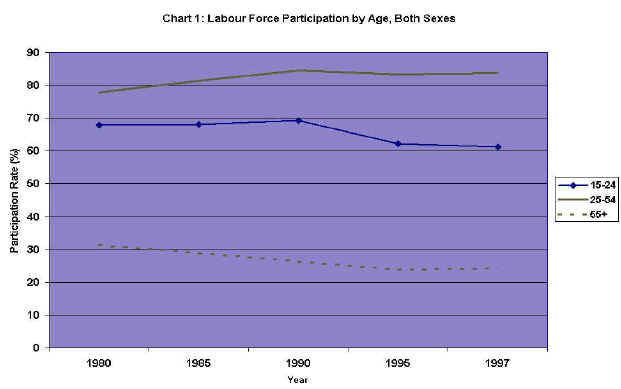
Chart 1 also depicts a steady decline in the participation rate among older workers. The decline in labour force participation for this group is entirely attributed to the decline in the participation rate of older men. Since the beginning of the last decade, the participation rate among men 55 years of age and over has dropped by 3.5 percentage points. This could be attributed to two factors – a trend toward intermittent participation or withdrawal from the labour force altogether. According to a recent study, the latter accounts for some three-quarters of the decline in the labour force participation of older men (see D. Gower, "Men Retiring Early: How Are They Doing?," Perspectives, Winter 1995). A stronger economy, however, is expected to draw some older workers back into the labour market, as evidenced by the slight increase in this group’s participation rate since 1996.
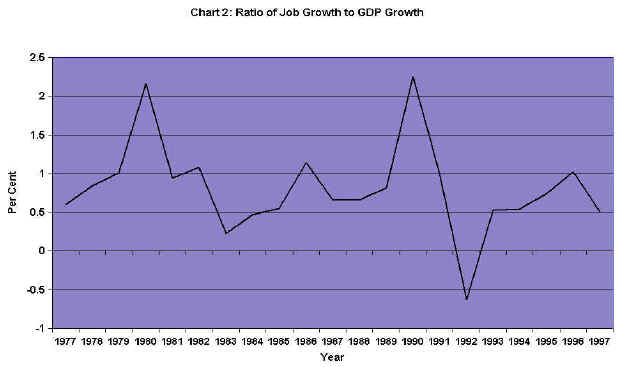
Not only has there been less growth on the supply side, growth in the demand for labour has also waned throughout the 1990s. Average annual employment growth during the period 1990-1999 was almost one-half the annual rate in the 1980s. This dramatic slowdown in job growth led some analysts to suggest that the historical relationship between economic growth and the demand for labour had been altered following the 1990-91 recession. Some even surmised that Canada was experiencing jobless growth in the initial years of the recovery.
According to the data underlying the 23-year period depicted in Chart 2, a 1% increase in aggregate output produced an average increase of 0.77% in employment. Following the onset of the last recession, this relationship appears to have weakened. In 1992, aggregate employment declined despite the existence of a larger economy. In addition, for each 1% increase in GDP during the period 1992-99, aggregate employment increased on average by only 0.39%; this is 0.27 of a percentage point below the average increase in employment witnessed in the seven years of economic recovery following the 1981-82 recession. According to recent research, one reason for the slowdown, at least during the early part of this period, was excessive growth in real wages. Between the 1st quarter of 1991 and the 4th quarter of 1993, real wage growth outpaced productivity growth by some 1.5 percentage points. Higher UI, CPP and workers’ compensation levies contributed to this situation. This research also concludes that the historical relationship between output and employment has not changed since the beginning of the decade (see P. Masse, Jobless Recovery: Is It Really Happening?, Human Resources Development Canada, October 1995).
While economic growth generated mostly full-time and relatively stable jobs throughout much of the post-war period, this is not the case today. There has been a decline in recent years not only in the growth of full-time jobs, but also in their share of overall employment. Compared to that of the previous decade, today’s workplace comprises proportionately higher levels of part-time, short-tenure and contract jobs, collectively called non-standard employment. Self-employment, which has become considerably more commonplace in today’s labour market, is included in this category. Throughout the period 1989-1999, the number of self-employed workers increased by 36.6%, compared to a 7.9% increase in the number of paid employees. In other words, self-employment accounted for 43% of total job growth throughout this period. (See Statistics Canada, Labour Force Historical Review, 1999).
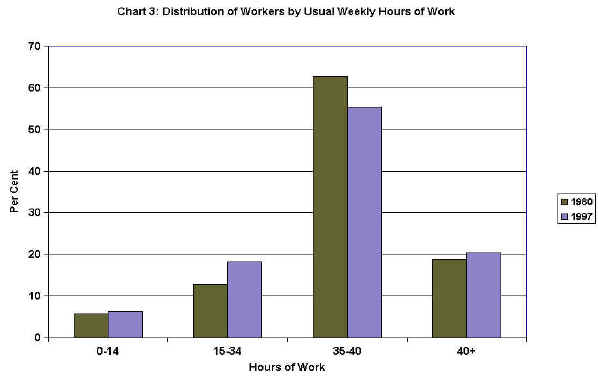
Despite the continued shift toward non-standard employment, average weekly hours of work have remained fairly stable since 1980. Underlying this apparent stability, however, is a redistribution of these hours, as illustrated in Chart 3. Compared to the beginning of the 1980s, proportionately fewer individuals currently work a "standard" workweek. In 1999, roughly 25% of all workers usually worked less than 35 hours per week, up by almost one-third from 1980; the proportion of workers with long hours remained similar in both periods, although this was not the case in the mid-1990s where the proportion of workers employed in long-hour weeks was somewhat higher.
The growth in non-standard employment has undoubtedly added flexibility to the workplace as it permits firms to adjust their labour needs and costs more quickly and accommodate workers who want to work outside the full-time regime. Some observers, however, are concerned about the growth in non-standard work-time as some of the new arrangements offer workers less job security, lower earnings, and fewer benefits. It has been suggested that the trend toward non-standard employment has contributed to a polarization of earnings (a widening gap between low and high wage earners) in Canada. The diminished payback period associated with short-tenure jobs could also discourage investments in human capital and thereby increase structural unemployment.
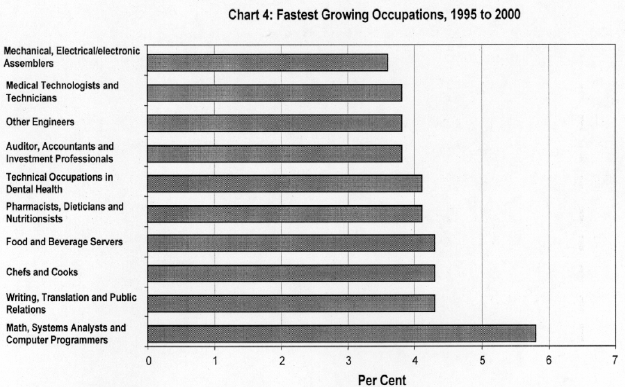
Not only is the proportion of labour used in the production of services continuing to increase, but the demand for the skills inherent in this labour is also changing. Over the years, the Canadian labour market has demanded higher skills and this trend is expected to continue in the years ahead. Support for this view is based, in part, on demand-side information generated by the Canadian Occupational Projection System. Chart 4 presents the ten occupations that are projected to grow the fastest during the period 1995-2000. Combined, these occupations are expected to account for 20% of net new job growth during this period. Approximately 20% of new jobs created during this period are expected to require management skills, 20% are expected to require a university degree, 20% will require a community college degree and some 33% are expected to require a high school diploma. If supply-side projections are incorporated into the analysis, labour market "tightening" (shortage) is expected in 82% of management occupations and 73% of occupations requiring a university degree (see W. Roth, Canadian Occupational Projection System: A Presentation of Results Using a Revised Framework, Human Resources Development Canada, 1995).
With the onset of the 1990-91 recession, the steady decline in unemployment witnessed over the latter half of the 1980s came to an abrupt halt. Throughout the period 1990 to 1992 the level of unemployment increased at an annual average rate of 15.8%, somewhat lower than the rate of increase in the corresponding three-year period in the previous recession. Also, unlike the case in the previous recession, Central Canada witnessed the largest relative increase in unemployment during the 1990-91 recession and the early stages of recovery. Western Canada, on the other hand, witnessed only two years of rising unemployment (compared to four in the previous recession), after which the level of joblessness began to fall. While the aggregate level of unemployment has steadily declined since 1993, its level in 1999 was approximately 12% above the pre-recession level of 1989. When labour force growth during this period is accounted for, the unemployment rate in 1999 was only 0.1 of a percentage point higher than in 1989.
Typically sensitive to downside cyclical changes, economic decline usually exerts its greatest initial impact on youth. In the early months of the 1981-82 and 1990-91 recessions the demand for young workers plummeted and the rate of unemployment among youth increased relative to that among adults. Although the relative labour market position of youths improved during the 1980s and early 1990s, this trend stopped in 1993; since that time, relative unemployment among youths has steadily increased. In 1999, the youth/adult unemployment rate ratio was 2.22, comparable to that found in the early 1980s.
During both the 1981-82 and 1990-91, recession, the relative position of women in the labour market improved markedly. In 1982 and 1983, the annual average unemployment rate of women expressed as a proportion of the rate for men was less than unity, a situation contrary to that usually found elsewhere in the business cycle. While this ratio exceeded one during the period 1983 to 1989, it dropped below unity once again in 1990 and has remained equal to or less than one ever since. In 1999, this ratio was equal to 0.94.
Although numerous important developments have emerged in the labour market since the beginning of the 1980s, many see the increase in long-term unemployment (i.e. unemployment lasting 53 weeks or more) as particularly significant. As illustrated in Chart 5, the burden of this increase appears to have fallen most heavily on adults, especially men.
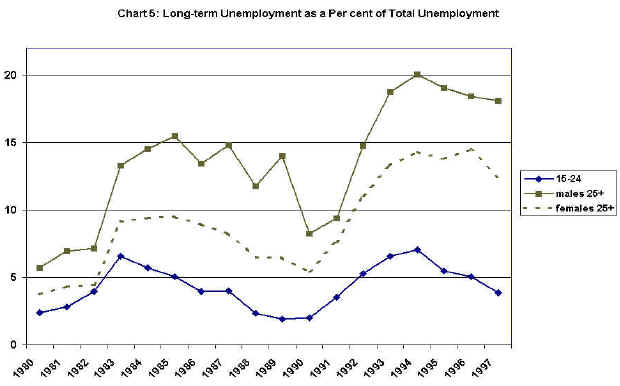
Statistics Canada reports that, in 1980, 33,400 individuals, 3.8% of all unemployed workers, experienced an unemployment spell lasting more than one year. Of these, 28% were youths, 24% were adult women and 48% were adult men. Since then, the incidence of long-term unemployment has more than doubled, to 8.0% (95,500) individuals) of all unemployed individuals in 1999. Its composition has changed dramatically; in 1999 youth accounted for 9% of all long-term joblessness, while adult women and men accounted for 33% and 58% respectively. This distribution marks a major shift in long-term unemployment away from youths to adults. The relative increase in long-duration unemployment at the top of the business cycle also suggests that structural unemployment has worsened since the beginning of the 1980s.
D. Quarterly Review (2nd Quarter 2000)
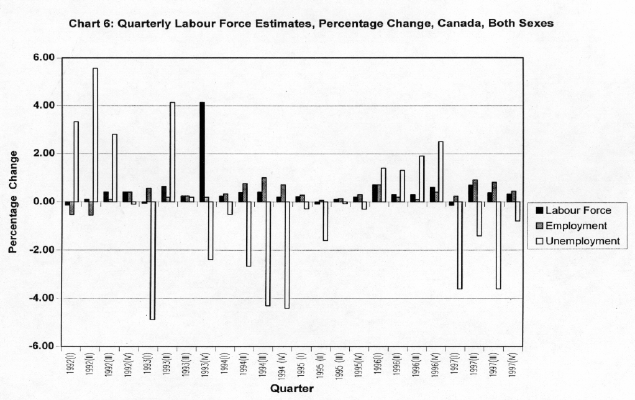
As illustrated in Chart 6, labour market conditions have continuously improved since the first quarter of 1997. During this period, both the level and rate of unemployment declined in each quarter. Over the last 14 quarters, the seasonally-adjusted level of unemployment has declined by 420,300 individuals and the unemployment rate has fallen by 3.2 percentage points.
The labour force in the second quarter of 2000 was slightly (0.25%) larger than in the previous quarter. Throughout the same period, the demand for labour increased by 0.4% or 60,300 individuals. More than one-third of the increase in employment during this period was attributed to growth in full-time jobs, a substantially smaller contribution to overall employment growth than that found since the last quarter of 1996. During this much longer period, growth in full-time jobs has accounted for more than 90% of total employment growth, a result that contrasts sharply with the long-term upward trend in non-standard employment.
As illustrated in Chart 6, the second quarter of 2000 marked the 14th consecutive quarterly decline in seasonally-adjusted unemployment. Between the first and second quarters of this year, the number of unemployed decreased by 18,500 (1.7%) individuals. The regional distribution of this decrease was far from uniform, with declines in Atlantic and Western Canada greatly exceeding that in Central Canada. When changes in labour supply are considered, the rate of joblessness between the first and second quarters of 2000 declined from 11.4% to 10.8% in Atlantic Canada, from 6.7% to 6.6% in Central Canada, and from 5.9% to 5.7% in Western Canada.
Although labour market legislation seldom dominates the parliamentary agenda, a number of reforms to what is now called Canada’s Employment Insurance Program has given some prominence to labour market issues in recent years.
Officially introduced in 1989, Bill C-21 (An Act to amend the Unemployment Insurance Act and the Employment and Immigration Department and Commission Act) did not become law until October of the following year. This law paved the way for a reallocation of $1.3 billion away from regular benefits to enhance initiatives for the unemployed (e.g., training course purchases, assistance for mobility and self-employment), a new special benefit structure and an extension of UI coverage to those 65 years of age and over. Also of great significance, Bill C-21 shifted the total cost of the UI to employers and employees, thus bringing to an end government contributions to the program.
On 26 February 1991, the Minister of Finance tabled a budget that called for a further increase in UI premiums in July 1991 and a $100 million cut in Canadian Jobs Strategy (CJS) spending. A similar cut in CJS funding was announced in the budget on 25 February 1992. In December of the same year, the Minister of Finance announced that new tax incentives would be developed and an additional $250 million would be spent over the next five years to encourage more training in industry. In addition, the Minister also announced that UI premiums in 1993 would be held at the 1992 level and a premium holiday would be extended to small firms to stimulate the creation of jobs. Moreover, the benefit rate would be lowered to 57% of average weekly insurable earnings and voluntary quitters and individuals who had lost their employment because of misconduct would be denied benefits.
Further changes to UI were contained in the Budget Implementation Act, 1994 (Bill C-17). Designed to reduce UI expenditures, these changes tightened the entrance requirement in high unemployment regions; introduced a new and less generous benefit structure and implemented a two-tiered benefit rate. In terms of the benefit rate, claimants with dependants who earn less than or equal to one-half of maximum weekly insurable earnings ($390 per week in 1994) receive 60% of average insurable earnings, while the benefit rate for all other claimants is 55%.
In 1994, the possibility of a major UI reform surfaced when the federal government launched its review of Canada’s social programs. While some of the legislative changes in Bill C -12 (An Act respecting employment insurance in Canada), adopted in June 1996, mark a new approach, the primary structure of the new program remains essentially unchanged. For example, the old weeks-based approach for determining benefit eligibility and duration is now based on hours (assuming a standard work week of 35 hours). Weekly benefits are now determined by averaging insurable earnings over a fixed, consecutive period of time (including weeks without earnings) known as the "rate calculation period." While the weekly benefit rate remains at 55%, this rate could decline by as much as five percentage points, depending on an individual’s claim history. In terms of income redistribution, the new law provides an income supplement to claimants who have children and a low family income. Moreover, the existing benefit repayment provision has been significantly strengthened by lowering the income threshold at which benefits are repaid as well as raising clawback rates according to an individual’s claim history. While claimants may continue to earn up to 25% of weekly benefits without experiencing a reduction in their benefits, low income claimants (i.e. those receiving weekly benefits below $200) are now entitled to an earnings exemption of up to $50 per week.
The new insurance system permits the program to generate and maintain surplus revenues. This measure is intended to minimize fluctuations in premium rates over the business cycle. According to the Main Estimates, the cumulative surplus in the EI Account is expected to reach $19.6 billion in 1998-99. This is well above the upper limit of $15 billion that the Chief Actuary of the EI Account deemed sufficient to meet the objectives of section 66 of the Employment Insurance Act.
The reconfigured insurance system also provides financial assistance – grants, contributions, loans and vouchers – under employment benefits (previously known as UI developmental uses). Eligibility for these benefits includes those who are eligible for unemployment benefits, those who have received regular benefits in the past three years and those who have received maternity or parental benefits in the past five years. As in the case of the UI reform in 1990, the government intends to redirect some program savings to employment benefits. On 30 May 1996, the Minister of Human Resources Development offered provincial and territorial governments the opportunity to assume responsibility for the labour market measures underlying employment benefits. To date, nine provinces and both territories have signed labour market development agreements with the federal government. Ontario is the only province that has not yet done so.
There are basically two types of agreement. Under one type, a province/territory assumes responsibility for administering Part II benefits. Under the other type, the federal government continues to deliver Part II benefits and co-manages program design with the province/territory. Of the 11 agreements signed to date, six involve provincial/territorial responsibility for the design and delivery of Part II benefits.
23 October 1990 - Bill C-21 received Royal Assent, thus paving the way for the government to implement its Labour Force Development Strategy.
26 February 1991 - In the budget, the Minister of Finance announced the government's Expenditure Control Plan, part of which called for a $100 million cut in Canadian Jobs Strategy expenditures in 1991-92 and a 24.4% increase in UI premiums in July of 1991.
29 October 1991 - The Ministers of Industry, Science and Technology and Employment and Immigration jointly announced the Prosperity Initiative. This initiative is a comprehensive consultation process designed to establish measures for enhancing Canada's international competitiveness. One aspect of this exercise that is expected to receive a great deal of attention is human resource development, especially in regard to basic education and enterprise-based training.
25 February 1992 - The Minister of Finance announced in his budget that CJS expenditures would be cut by $100 million in 1992-93. While this was more than offset by an increase in UI developmental expenditures, it will probably have an adverse impact on the non-UI claimant population served under Employment and Immigration's Employment Activity.
29 October 1992 - The Steering Group on Prosperity released a report entitled Inventing Our Future: An Action Plan for Canada's Prosperity. The report contained a number of recommendations covering a broad spectrum of issues ranging from the need for more disciplined fiscal policy, fair and competitive tax structures and a single Canadian market to the creation of a strong learning culture and a society where all individuals participate in, and benefit from the opportunities flowing from a more prosperous Canada.
2 December 1992 - The Minister of Finance announced in his economic statement that new tax incentives would be developed and $250 million spent over the next five years to encourage the private sector to undertake more training. The Minister also announced that unemployment insurance premiums in 1993 would remain unchanged at 1992 rates and the government would waive employer premiums, up to a maximum of $30,000 per small enterprise, to encourage small firms to hire additional workers.
17 February 1993 - Bill C-113, Government Expenditures Restraint Act, 1993, No. 2, was tabled in the House of Commons. Part IV would amend the Unemployment Insurance Act by reducing the benefit rate from 60% to 57% of insurable earnings until 1 April 1995 and would impose a total disqualification on claimants who voluntarily leave employment without "just cause" or who lose their employment due to misconduct.
26 April 1993 - Although the Minister of Finance announced in the budget that the lower UI benefit rate would remain at 57% beyond April 1995, this provision was never proclaimed.
23 June 1993 - Bill C-101 (An Act to amend the Canada Labour Code and the Public Service Staff Relations Act) received Royal Assent. These changes were designed to make employment standards under the Code more equitable vis-à-vis workers, reduce employers’ administrative burden and introduce a mechanism to help resolve disputes that could adversely affect the public interest.
December 1993 - The First Ministers approved the Canada Infrastructure Works Program, a $6-billion program whose costs are shared equally by the federal, provincial/territorial and municipal governments. As of August 1996, over 12,000 projects had been approved and roughly 97% of total funding had been committed. Assuming about 60% incrementality, it was estimated that the net job creation impact of the program over a ten-year period would be about 81,000 person-years.
18 January 1994 - In the Speech from the Throne opening the first session of the thirty-fifth Parliament, the government announced its intention to, among other things, move quickly on its short-term job creation program (i.e., the tripartite infrastructure program), create a Youth Service Corps and reform Canada's income security system (including unemployment insurance) within two years.
22 February 1994 - the Minister of Finance announced in the budget that some $400 million would be made available in each of the fiscal years 1995-96 and 1996-97 to fund innovative social assistance projects. In addition, the budget provided $1.7 billion for the Atlantic Groundfish Industry Renewal and Adjustment Strategy.
15 June 1994 - The Budget Implementation Act, 1994 received Royal Assent. Part V of this Act amends the Unemployment Insurance Act by changing the variable entrance requirement from 10-20 weeks of insurable employment to 12-20 weeks, depending on the regional unemployment rate; reducing benefit entitlement; and adopting a two-tier benefit rate to assist low income claimants with dependants.
23 June 1994 - The Canada Student Financial Assistance Act received Royal Assent, thus paving the way for, among other changes, an increase in loan limits for both full-time and part-time students. The maximum loan for part-time students increased by 60% to $4,000 per year.
5 October 1994 - The Minister of Human Resources Development tabled a Discussion Paper on reforming Canada's social security system. The paper provides a number of suggestions for changing, among other things, employment development services, unemployment insurance, transfer payments for post-secondary education, social assistance and the child tax benefit. The Standing Committee on Human Resources Development held public hearings on these proposals and tabled its report on 6 February 1995.
15 December 1995 - Bill C-64 (An Act respecting employment equity) received Royal Assent. In general terms, Bill C-64 amended the Employment Equity Act to put the federal public sector under the legislation, to provide guidance to employers on their obligations, and to clarify these and to create an enforcement mechanism to ensure employer compliance.
20 June 1996 - Bill C-12 (An Act respecting employment insurance) received Royal Assent, replacing the Unemployment Insurance Act. Employment insurance was designed to achieve three primary policy objectives: to reshape Canada’s unemployment insurance system to better address the coverage and adjustment needs of unemployed individuals; to reduce the extent to which the program encourages firms and workers to use it (i.e. the problem of repeat use); and to reduce program expenditures and improve the program’s financing structure so as to stimulate job creation.
1 July 1996 - The Minimum Hourly Wage Order, 1996 came into effect. As a result of this change, the federal minimum wage is now aligned with the general minimum wage rate in each province and territory. As of 1 July 1996, the federal minimum hourly wage increased from $4.00 to a low of $4.75 in Newfoundland and a high of $7.00 in British Columbia.
30 August 1996 - The Minister of Labour established an Advisory Committee to examine a broad range of issues dealing with the changing nature of work. The Advisory Committee, chaired by the Minister of Labour, released its report in June 1997. The report contains seven broad recommendations such as the need to develop labour regulations that deliver the same basic rights to all workers, including the growing number employed in non-standard jobs. In addition, public policy should not create artificial incentives that make one work time arrangement more attractive than another.
12 February 1998 - The first Employment Insurance Monitoring and Assessment Report was tabled in the House of Commons. While data limitations permitted only a preliminary analysis, it is estimated that between July 1995 - June 1996 and July 1996 - June 1997 total expenditures on benefits declined by 11.5%; expenditures on Part II measures declined by 29%; the number of new claims (excluding those under Part II of the Act) declined by 15%; and the proportion of claimants exceeding minimum insurability limits increased (at least during the first six months of the reform). According to this report, the ratio of the number of regular EI beneficiaries to the number of unemployed declined from 83% in 1989 to 43% for the 12-month period ending in October 1997. Human Resources Development Canada is currently studying this trend and the results should be available by the end of this year.
24 February 1998 - The budget announced several measures, including scholarships, tax-free RRSP withdrawals for lifelong learning and tax relief for interest to help individuals finance their education. The link between education and jobs is clear – employment rates are higher and unemployment rates are lower among more highly educated workers than among their less educated counterparts.
The Minister of Finance also announced an EI premium rebate to encourage employers to hire young Canadians (18 to 24 years of age) in 1999 and 2000. Unlike the New Hires Program, which is not age-specific, this new proposal may simply lead to the displacement of non-youth workers. The government also intends to allocate additional funds ($50 million in 1998-99, $75 million in 1999-2000 and $100 million per year thereafter) to help young individuals, primarily those who have not completed high school, to secure employment.
19 June 1998 – The government announced that it would allocate $730 million to help individuals and regions affected by the collapse of the Atlantic ground fish industry. Up to $250 million will be devoted to retiring fishing licences, $180 million will be used for final payments to former TAGs clients, $65 million for early retirement, $135 million for active labour market measures and $100 million for community economic development.
14 December 1998 – The government announced that the temporary Transitional Jobs Fund (scheduled to end on 31 March 1999) would be replaced by a permanently established measure called the Canada Jobs Fund (CJF). The CJF will receive an annual budget of $110 million. Regions with an unemployment rate of 10% or more will be eligible under the new program (previously regions with an unemployment rate of 12% or more were eligible).
29 April 1999 – The Aboriginal Human Resources Development Strategy was launched. This Strategy is a five-year, $1.6-billion multi-initiative designed to expand employment opportunities for Aboriginal people across the country. It builds on the Regional Bilateral Agreements that transferred responsibility for designing and delivering labour market programs directly to Aboriginal organizations.
18 June 1999 – In view of the long periods of joblessness experienced by individuals 55 years of age and over, the government announced that it would allocate $15 million this year and next to help fund pilot projects designed to develop new approaches for enhancing the employment prospects of displaced older workers. These projects will be guided by the Forum of Labour Market Ministers’ Working Group on Older Workers.
1 June 2000 – The government announced its intention to provide financial support to the recently created Canadian Apprenticeship Forum (CAF). The composition of the CAF is much like that of the now defunct Canadian Labour Force Development Board with representatives from business, labour, education and equity groups. The CAF intends to support and promote the development of Canada’s apprenticeship training systems and thereby contribute to skill development in the workplace.
22 June 2000 – The government announced that it would terminate the Canada Jobs Fund, one of the programs that had been severely criticized following the release of an internal audit on the administration of Human Resources Development Canada grants and contributions. Funding for the CJF will be reallocated to regional economic development agencies.
Betcherman, G. et al. The Canadian Workplace in Transition. IRC Press, Queen’s University, 1994.
Canada. From Unemployment to Employment Insurance: A Supplementary Paper. Minister of Supply and Services Canada, 1994.
Green, C. et al. Unemployment Insurance: How to Make It Work. C.D. Howe Institute, 1994.
OECD. The OECD Jobs Study. Paris, 1994.
Picot, G. and Ted Wannell. "Job Loss and Labour Market Adjustment in the Canadian Economy." The Labour Force, March 1987.
Riddell, W.C. Work and Pay: The Canadian Labour Market. Prepared for the Royal Commission on the Economic and Development Prospects for Canada, University of Toronto Press, 1985.
* The original version of this Current Issue Review was published in January 1989; the paper has been regularly updated since that time.