91-2E
FISCAL POLICY IN CANADA:
THE CHANGING ROLE OF THE
FEDERAL AND PROVINCIAL GOVERNMENTS
Prepared by:
Jean Soucy, Economics Division
Marion G. Wrobel, Senior Analyst
Revised 27 March 2000
TABLE
OF CONTENTS
1. Total Spending
2. Program
Spending vs. Debt Service Charges
D. Federal Transfers to the Provinces
E. The Harmonized Sales Tax (HST)
FISCAL POLICY IN
CANADA:
THE CHANGING ROLE OF THE FEDERAL AND PROVINCIAL GOVERNMENTS*
Economic policy is increasingly being conducted by provincial governments. While monetary policy is exclusively in the federal domain, fiscal policy is a shared responsibility. Attention tends to be focused on taxes, spending and deficits at the federal level, but those at the provincial level are in aggregate just as important. The federal government supplies a significant amount of the financial resources of the provincial governments ($25,523 million in cash transfers in fiscal year 1998-1999, around 15.6% of total provincial government revenues on a public accounts basis; this amount includes $3,500 million as a one-time CHST cash supplement paid to a third-party trust.) The federal government also gives the provinces $13,751 million in tax points.
This paper examines some of the prominent trends in provincial and federal fiscal policy since 1975 in order to provide a background against which total fiscal policy and future federal budgets can be evaluated. This is a companion piece to three Current Issue Reviews dealing with federal fiscal policy: CIRs No. 87-2, (Federal Spending), 88-7 (Federal Deficit), and 90-3 (Federal Revenues). The data in this paper for Figures 1 to 5 came from Statistics Canada's National Economic and Financial Accounts and for Figures 6 to 8 from federal and provincial Public Accounts.
Figure 1 portrays developments with respect to government income. Prior to 1964, provincial revenues were less than 80% of those of the federal government. Provincial revenues grew at a much faster pace than federal revenues over the next decade and a half; consequently, the ratio of provincial to federal revenues was 1.28:1 in 1978 (see Figure 1). Over the next three years, federal income grew rapidly, dropping the ratio to 1.09:1 in 1981. Since then this ratio has fluctuated between 1.09:1 and 1.26:1.

An examination of the major tax categories -- direct taxes from persons, direct taxes from corporations, and indirect taxes -- explains these overall trends. In all three cases, the provinces have increased their share of tax revenues. The ratio of provincial to federal direct taxes from corporations increased from 0.33:1 in 1966 to 0.66:1 in 1995. Since 1969, provincial governments have collected more than half of indirect tax revenues in Canada. The ratio of provincial to federal indirect taxes rose from 1.01:1 to 1.77:1 in 1998. This trend was not affected by the introduction in 1991 of the Goods and Services Tax (GST) at the federal level.
The equivalent ratio for direct taxes from persons (mostly personal income tax (PIT), a much more important component of tax revenues) increased from less than 0.30:1 before 1965 to 0.64:1 in 1998. In fact, the provincial share of direct taxes from persons increased dramatically between 1976 and 1978, when it reached 75% of the federal share. It fluctuated afterwards in a range between 0.62:1 and 0.71:1. These trends are shown in Figure 2.
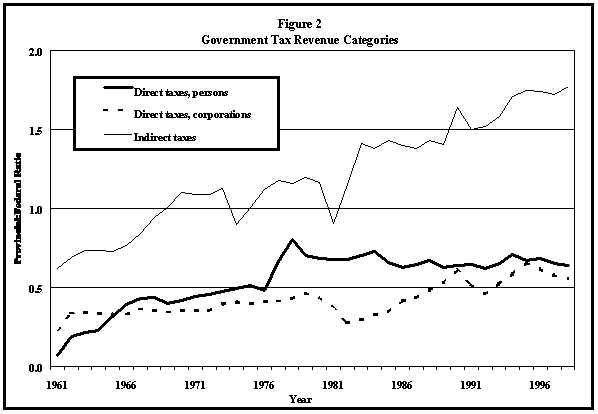
This dramatic change in the relative share of direct taxes from persons between 1976 and 1978 was intentional. Under the Established Programs Financing Agreements negotiated in 1977 between the Government of Canada and the provinces, the federal government made tax room available to the provinces. As a result, provincial tax rates rose substantially. These increases were 27% in Manitoba, 28% in Nova Scotia, 38% in Prince Edward Island, 44% in Ontario, and 48% in Alberta.
After 1978, the provincial share of direct taxes from persons declined somewhat and fluctuated. The reversal of this trend may be due to provincial government responses to the federal government's income tax reform, which has reduced the reliance on the personal income tax. Several provinces (Prince Edward Island, New Brunswick, Saskatchewan and, most notably, Ontario) have used this opportunity to increase their rates and to add surtaxes as deficit control measures. The recent moves by New Brunswick and Ontario to reduce income taxes by 10% and by more than 30% respectively will reduce the relative shares of direct taxes from persons going to those provinces in the latter half of the 1990s.
Provincial governments now occupy a very large part of the area of indirect taxes, defined here as taxes that add to the cost of production. They include retail sales taxes, motive fuel taxes and other sales taxes at the provincial level, sales and excise taxes at the federal level, import duties and property taxes.
The sharp rise of the provincial share of indirect taxes was due primarily to a drop in the general Federal Sales Tax (FST) from 12% to 9%, while at the same time a number of provinces increased their retail sales tax rates. For example, from 1976 to 1983, the retail sales tax was increased by two percentage points in each of the Atlantic provinces and by one point in Quebec and Manitoba. After 1984, the federal share of taxes increased as the government returned the general Federal Sales Tax rate to 12% and increased the FST rate on building materials from 5% to 8%.
The introduction of the federal Goods and Services Tax (GST) in 1991 was to increase the federal share of consumption taxes, all other things being equal. There are two major reasons for this. First, the GST is meant to be revenue-neutral with respect to a Federal Sales Tax of 13.5%, not the 12% that existed in the first half of 1989. Second, the GST is to be revenue-neutral in net terms, not gross terms. Since the tax finances an expanded system of refundable tax credits, larger gross revenues should be expected. On balance, though, the impact has been minor due to disappointing GST revenues.
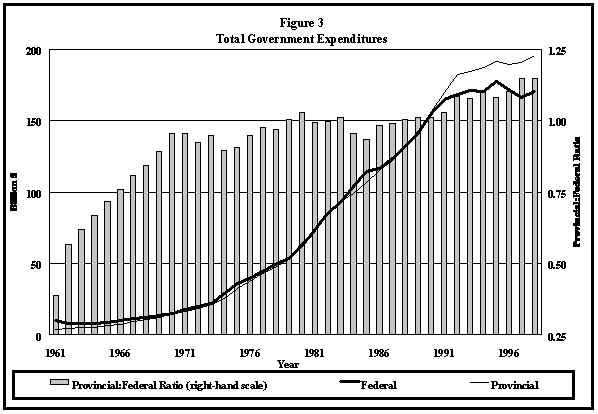
In aggregate, the federal government today spends about the same amount as the provinces. Through the last half of the 1960s and early 1970s, the provincial share of total government spending increased steadily. Since that time, the trend has levelled off (see Figure 3).
2. Program Spending vs. Debt Service Charges
The real difference between federal and provincial government spending is revealed in debt service charges (see Figure 4). Even though the interest rate faced by provincial governments tends to be higher than that faced by the federal government, provincial debt service charges are substantially lower. This indicates a much lower stock of debt held by the provincial government sector, the result of smaller past deficits. This trend will probably change in the short term, however. Since the federal government has done well since 1997 –achieving a surplus of around $3 billion each fiscal year – and some provinces are still in deficit, the ratio of provincial-federal debt charges will rise.

From 1966 to 1973, the provincial share of total debt service charges rose dramatically, after which it declined until 1981, when it stood at 0.48:1. The provincial share rose through most of the '80s but subsequently fell sharply from 1988 to 1990, after which it once again grew rapidly.
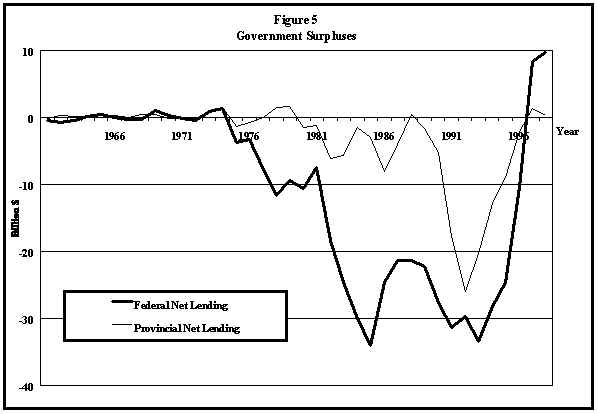
The explanation for this pattern can be found in Figure 5, which looks at annual deficits. In 1965, the federal government ran a surplus. After that year, the relative importance of provincial deficits changed dramatically from year to year. From 1975 to 1989, the ratio of provincial deficits to federal deficits averaged 0.13:1, although experiencing large fluctuations. The federal government was accumulating debt much more rapidly than the provinces, thereby contributing to relatively higher debt servicing costs. From 1990 to 1993, however, provincial deficits and the ratio of provincial to federal deficits, increased significantly, contributing to a rise in the provincial share of debt service charges. For those years, provincial deficits grew faster than their federal counterpart. However, they subsequently fell faster than federal deficits. Recent data show that this trend has changed considerably. The federal government’s last three budgets, including the one for the fiscal year 1999-2000, have been at least balanced. There is no federal deficit, though there are still some provincial deficits.
In 1989 and 1990, interest rates were very high, especially for financial paper with short terms to maturity. The federal government had been moving to a greater reliance on short-term securities, especially Treasury Bills, since these typically yield less than long-term bonds. The irony of this policy is that it had increased federal borrowing costs because short-term paper had a substantially higher yield than long-term paper in 1989 and 1990. In addition, the use of short-term instruments and high annual deficits meant that the federal government was very susceptible to the increases in interest rates that occurred in 1989 to 1990. The federal government has now increased the average term to maturity of its debt. While this will increase borrowing costs somewhat, it will render them more stable and predictable by making the federal debt less sensitive to interest rate changes. The share of interest-bearing debt at fixed rates increased from about 50% in 1992-93 to about 67% in 1998-99.
The following discussion is based on data from federal and provincial Public Accounts. Like that of the federal government, the fiscal position of the provinces was impaired significantly by the recession of the early 1980s. The deficit of both levels of government ballooned after 1982. But whereas the deficits of provincial governments started to decline immediately after 1983, the federal deficit continued to grow until 1985. And whereas the federal decline was relatively small, the provincial decline was more dramatic. The federal deficit in 1990 was 75% of what it was in 1985, when it peaked, and almost equivalent to what it was in 1983, when the recession ended. Total provincial government deficits in 1990 were 32% of the peak level reached in 1987 and 48% of the level reached in 1983.
In 1992, provincial deficits increased substantially, largely due to developments in the province of Ontario, and increased even further the next year. According to the National Accounts, for the first time since the early 1970s the ratio of provincial to federal deficits exceeded 0.60:1.
The provincial government sector has in the past been more apt than the federal government to balance its budgets in aggregate. Although the decade of the 1980s has also been characterized by high deficits in the provinces, governments there have been better able than the federal government to restore some sense of fiscal prudence.
The aggregate decline in provincial deficits since 1983 has not been without its reverses. The total of these deficits increased in 1986 and 1987, due mainly to a dramatic increase in the deficits of the four western provinces, which in 1985 had been essentially balancing their budgets, yet by 1987 were running deficits totalling over $6,200 million. The reason for this is clear. Natural resource prices declined substantially in these years and the real value of output fell by 5% in 1986 and did not grow in 1987.
The situation in Ontario was different. From 1983 to 1989, real growth averaged 6.2% per annum, which is exceptionally high by any standard. Yet, not only was the decline in the deficit slow over this period, in 1986 the deficit actually doubled from the previous year. In Quebec, the deficit pattern varied only slightly from that of Ontario, even though real growth, at an average of only 4.7% per annum, while very good, was 1.5 percentage points less than in Ontario.
Figures 6 to 8 look at some recent summary fiscal statistics for Canadian governments; the data are from the Fiscal Reference Tables issued by the Department of Finance updated on the basis of recent budgets. Data on Quebec net debt for 1998-99 are from Scotiabank, Provincial Pulse, 3 December 1999.
One reason that the provinces have been so much more able than the federal government to control their deficits in recent years is that they were more able to avoid deficits in the past. Consequently, in 1999, on average only $1 of every $7.9 of the provinces’ revenues represented interest charges, but more than $1 out of every $3.8 of federal revenue did so.
Figure 6 shows government debt servicing costs for Canada and each province for 1997 compared to 1998, expressed as a proportion of each government’s total revenues. The federal government has by far the greatest debt servicing problem, as it spends just under 27 cents of every dollar of revenue on interest payments, more than twice the provincial average. Manitoba, Alberta and British Columbia pay less than 10 cents of every revenue dollar on interest costs.
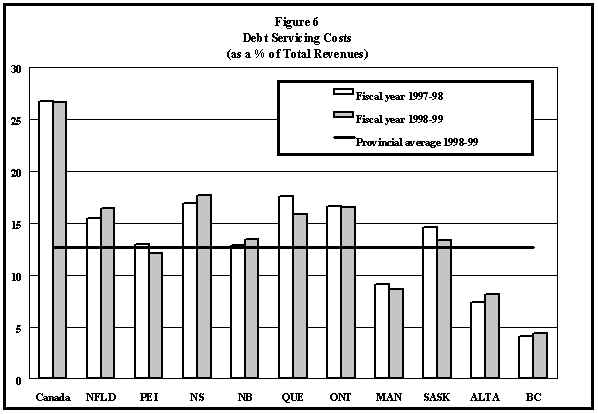
Debt servicing costs give an indication of the amount of fiscal flexibility a government enjoys. Provinces such as Manitoba, Alberta and BC use the vast proportion of their revenues on discretionary spending and hence will theoretically find it easier to implement fiscal restraint. The job of the federal government is more difficult as more than one-quarter of its revenues is already spoken for.
The 1996 federal deficit equalled 3.5% of GDP. Figure 7 looks at government deficits for fiscal years 1998 and 1999, expressed as a percentage of GDP. By this measure, Quebec had the worst performance of any government in 1998, followed closely by Ontario. In 1999, however, these provinces improved their budgetary situation, with Quebec even realizing a surplus. Nova Scotia and New Brunswick offered the worst performances of all the provinces. The budgetary situation also deteriorated in British Columbia. The federal government maintained its position in government finances. Federal budgets should continue to be balanced from now on.
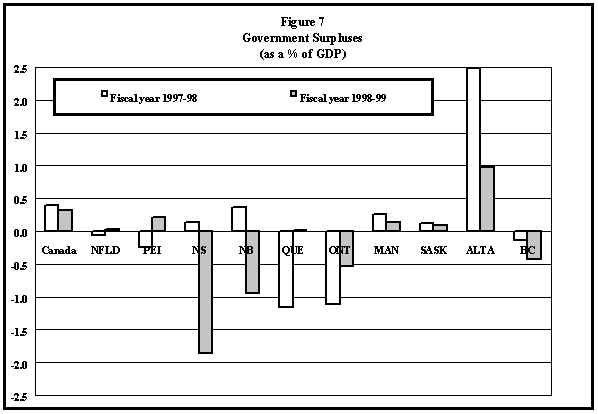
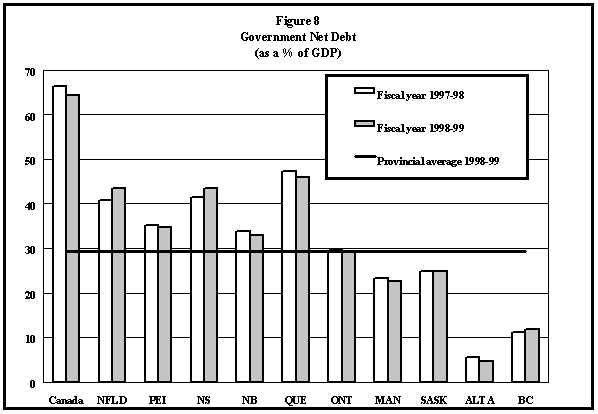
Figure 8 presents government debt to GDP ratios in 1998 and 1999. The federal government stands out with a debt to GDP ratio that is twice the provincial average. As one would expect, governments with higher debt levels face higher debt servicing costs and this pattern is borne out by a comparison of Figures 6 and 8. The Ontario government stands out as an apparent anomaly, however. Its net debt is at the provincial average, but debt-servicing costs are well above the provincial average. This is due to the Ontario government’s personal income tax cuts that are reducing revenues substantially.
D. Federal Transfers to the Provinces
The 1990 and 1991 federal budgets restricted the amount of cash transfers that the federal government provided to the provinces. In 1990, the federal government announced a two-year freeze on per capita Established Programs Financing transfers to the provinces; the 1991 budget extended this freeze for three years. Canada Assistance Plan payments to non-equalization receiving provinces would be limited to 5% annual growth for the next five years. These measures were expected to reduce cash transfers by over $5,000 million in five years, even though such federal transfers would continue to grow at higher rates than those for federal program spending.
The provinces could respond to these federal initiatives by reducing spending or increasing taxes. The provinces had already been accustomed to a decreasing reliance on federal cash transfers, which accounted for 23% of provincial revenues in 1975 but for only 19% of revenues in 1989. More and more, the provinces were using their own tax measures to raise revenue. If the alternative to these budgetary measures was to be continued levels of cash transfers coupled with higher federal taxes, a provincial tax increase would be equivalent to a conversion of cash transfers into tax transfers. This was consistent with past developments.
As of 1 April 1996, the bulk of federal transfers to the provinces were in the form of the Canada Health and Social Transfer (CHST), a block grant replacing the CAP and EPF funding but which did not affect equalization. Along with this reform in structure came a reduction in total provincial entitlements and cash transfers.
The 1996 budget established a five-year funding arrangement that froze total entitlements for two years at the 1997-98 level of $25,000 million and allowed total entitlements to grow after that at an increasing pace. The 1996 budget also stated that a floor for cash transfers would be established at $11,000 million. This was important because the government’s ability to enforce the provisions of the Canada Health Act and the non-residency requirements for social assistance depended upon a significant federal cash contribution that could be withheld in the event of non-compliance by a province. The cash floor has now been increased to $14,500 million. This amount does not include the CHST cash supplements announced in the two last federal budgets.
The 1996 budget also indicated that the federal government had gone some way in addressing the arbitrariness of the original CHST entitlement allocation. Initially, the entitlement for each province was set at about 9.5% less than the previous year’s entitlement under CAP and EPF. This led to wide variations in per capita funding. The three non-equalization receiving provinces felt aggrieved because they had previously been subject to the cap on CAP, which had severely restricted their access to federal transfers. The federal government reformed the allocation to reflect population growth, thereby reducing by about half the initial variation in per capita entitlement.
E. The Harmonized Sales Tax (HST)
On 1 April 1997, residents of Nova Scotia, New Brunswick and Newfoundland saw the elimination of the GST and provincial retail sales taxes. They were replaced by an HST of 15%, applied essentially to the old GST base. As this new tax was expected to generate substantially lower revenues for these provinces, the federal government has transferred almost $1 billion to them as a way of cushioning the transition.
For these three provinces, the new HST constitutes a harmonization of the federal GST and provincial retail sales taxes into a new value-added tax that very much resembles the old GST. At the retail level, consumers and retailers in these provinces now face only one tax, applied to a common base and administered by only one government.
Fiscal policy at both levels of government is usually set at budget time and given legislative authority through the Parliament of Canada or the legislatures of the various provinces. The basic framework for federal transfers to the provinces can be found in a number of federal pieces of legislation. These include: the Federal-Provincial Fiscal Arrangements and Established Programs Financing Act, 1977; the Federal-Provincial Fiscal Arrangements and Federal Post-Secondary Education and Health Contributions Act, 1977, (actually passed in 1983); the Canada Health Act; and the Canada Assistance Plan.
1975 - The government of Alberta ran a surplus of $39 million, in addition to the $646 million paid into the recently established Heritage Savings Trust Fund.
- A new federal-provincial agreement on Established Programs Financing made extensive use of tax transfers. Provincial governments increased their personal income tax rates substantially.
1977 - The Newfoundland budget established the provincial PIT rate at 58% of basic federal tax, a level significantly higher than in any other province.
1981 - The Nova Scotia budget forecast a deficit more than twice as large as the previous year's and equal to 20% of projected revenue.
1982 - The Newfoundland budget set the retail sales tax at 12%, significantly higher than in any other province.
- The Quebec deficit reached $3,000 million for the first time, an amount which was exceeded in every year until 1987.
- The Ontario government extended the base upon which the retail sales tax was applied, resulting in a substantial increase in revenues.
- The budget of the government of Saskatchewan forecast a deficit, the first since 1977.
1987 - The government of Alberta forecast a deficit of $2,100 million, despite the fact that resource revenues were used as budgetary revenues and not placed in the Heritage Fund.
- The Saskatchewan budget noted that the deficit, previously forecast to be $389 million, would in fact be $1,235 million. That budget called for the elimination of 2,000 civil service positions.
1988 - Stage I of tax reform was implemented. It generally lowered tax rates for personal and corporate income, while broadening the base of taxable income. Some provinces used this opportunity to increase their own rates of tax. Prince Edward Island increased its PIT rate to 57% from 55%, and levied a 10% surtax.
- The province of Quebec announced a generous child subsidy plan which would pay as much as $3,000 per child to larger families.
April 1989 - The federal budget limited the growth in per capita Established Programs Financing to the rate of growth of GNP, less three percentage points.
February 1990 - The federal budget contained an expenditure control plan which limited transfers to the provinces. Established Programs Financing payments for fiscal years 1991 and 1992 were limited to their 1990 per capita levels. For the same years, Canada Assistance Program payments to Ontario, Alberta and British Columbia were limited to a 5% annual growth rate.
January 1991 - The Goods and Services Tax was implemented as originally planned. The retail sales tax in the province of Quebec, applying to goods only, was integrated with the GST.
July 1992 - Services were added to the Quebec base.
April 1997 - The Harmonized Sales Tax at 15% in Nova Scotia, New Brunswick and Newfoundland would replace the GST and retail sales taxes in those three provinces.
February-March 2000 - The federal government announced significant tax reductions; most provinces subsequently did the same.
Bank of Canada Review. Ottawa, various issues.
Canada, Department of Finance. The Budget. Tabled in the House of Commons by the Honourable Michael H. Wilson, Minister of Finance, Ottawa, 20 February 1990.
Canada, Department of Finance. Debt Management Strategy - 2000-01. Ottawa, 23 March 2000.
Canadian Tax Foundation. Provincial and Municipal Finances. Toronto, 1990.
Canadian Tax Foundation. The National Finances. Toronto, 1990.
Domingue, Richard. Harmonization of Sales Taxes. Current Issue Review 94-1, September 1996.
Horry, I.D. and M.A. Walker. Government Spending Facts. The Fraser Institute, Vancouver, 1989.
Ip, Irene K. Big Spenders - A Survey of Provincial Government Finances in Canada. Policy Study 15, C.D. Howe Institute, Toronto, June 1991.
Perry, J. H. A Fiscal History of Canada. The Postwar Years. Canadian Tax Paper No. 85. Canadian Tax Foundation, Toronto, 1989.
Perry, J.H. Taxation in Canada. Fifth Edition. Canadian Tax Paper No. 89. Canadian Tax Foundation, Toronto, 1990.
Statistics Canada. Provincial Government Finance. Cat. No. 68207. Annual, Ottawa, various issues.
Toronto Dominion Bank. TD Report on Provincial Government Finances. August 1996.
Wrobel, M.G. Budgets 1996: Continuing Restraint by Federal, Provincial and Territorial Governments. BP-425, August 1996.
* The original version of this Current Issue Review was published in January 1991; the paper has been regularly updated since that time.