|
Parliamentary Research Branch |
MR-115E MEDICATION COSTS IN CANADA
Prepared by
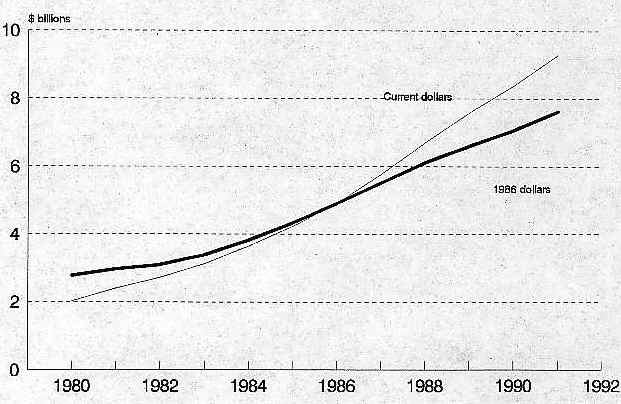
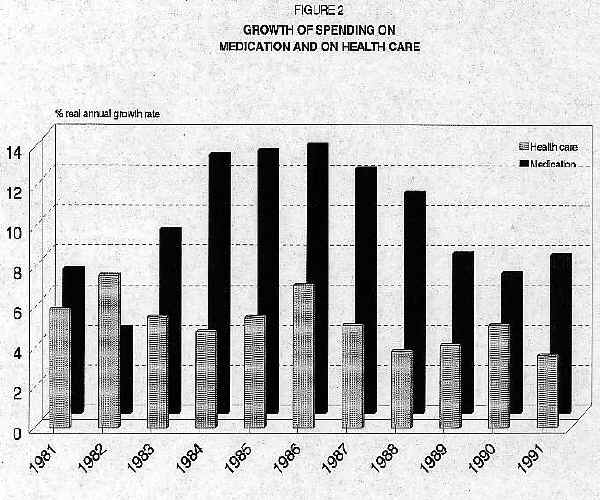
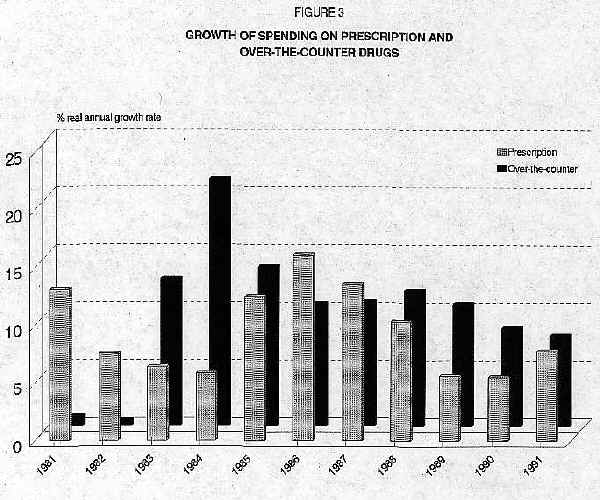
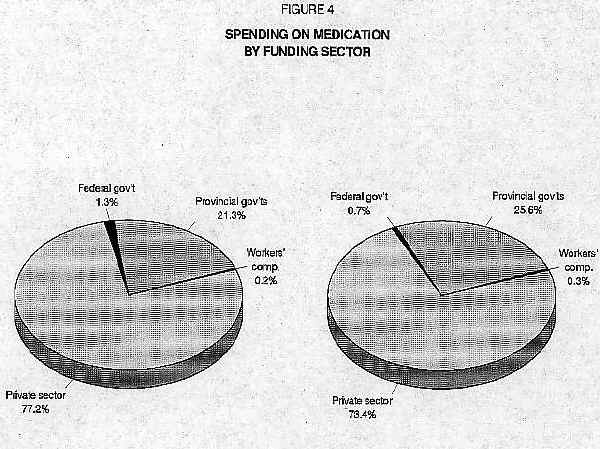
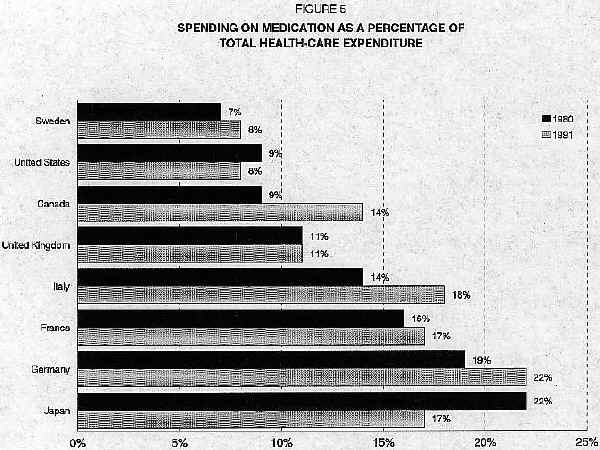
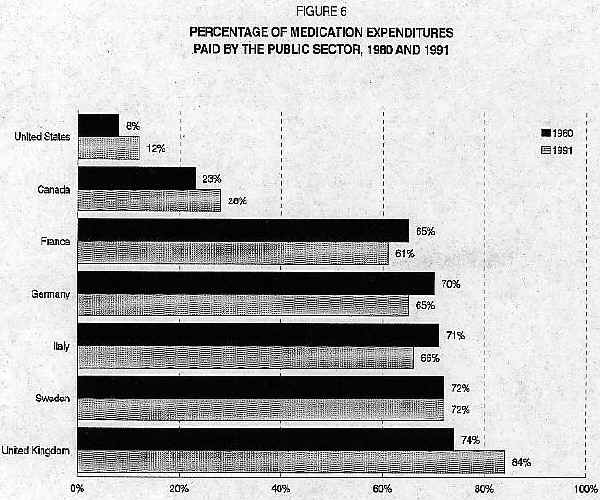
TABLE OF CONTENTS MEDICATION'S SHARE IN TOTAL HEALTH-CARE SPENDING PRESCRIPTION DRUGS AND OVER-THE-COUNTER DRUGS COMPARISONS WITH OTHER OECD COUNTRIES CAUSES OF INCREASED SPENDING ON MEDICATION MEDICATION COSTS IN CANADA Currently there are some 18,000 pharmaceutical products available on the Canadian market; for the most part, they are used to treat, alleviate or prevent a vast range of human maladies. Pharmaceutical products intended for human consumption can be divided into two groups: prescription drugs, for which a physician's authorization is required, and non-prescription or over-the-counter drugs, like cough syrups and aspirin, which may be bought freely. Overall, medication is the commonest medical treatment in Canada, and its use has increased in all age categories in recent years. Moreover, of all the elements that make up total health-care expenditure, medication costs have gone up the fastest. In this paper, we will look at how spending on medication has changed in Canada between 1980 and 1991. Figure 1 (all graphs are at the end of the text) traces the evolution of total expenditures on medication in Canada, in current dollars and in constant 1986 dollars. In 1991, Canadians spent $9.3 billion on medication, an average annual expenditure of $330 per person. By comparison it should be noted that in 1980 these expenditures totalled $2 billion, or $83 per person. Total expenditures on medication in Canada have been going up by an average of almost 15% per annum since 1980. Expressed in constant 1986 dollars, the sum went from $2.8 billion to $7.6 billion between 1980 and 1991, a real average annual growth rate of 10%. Over the same period the cost of medication per person in 1986 dollars more than doubled, going from $113 to $270. MEDICATION'S SHARE IN TOTAL HEALTH-CARE SPENDING Figure 2 compares the real annual growth rate of total spending on medication with that of total spending on health care. It shows that spending on medication has increased much faster than total health-care expenditures. While the real average annual growth rate of spending on medication was almost 10% between 1980 and 1991, the real average growth rate of total health-care spending was just over 5% annually; thus, the proportion of total health-care spending attributable to expenditures on medication has increased sharply, from 9% in 1980 to 14% in 1991. This represents the most rapid increase over the past decade in any of the categories that make up total spending in this area. Moreover, it is expected that medication's share in total health-care expenditures will in the next few years become larger than the share accounted for by physicians' services. PRESCRIPTION DRUGS AND OVER-THE-COUNTER DRUGS Each of the two types of medication for human consumption represents a relatively stable proportion of overall spending on medication. About 52% of total spending went on prescription drugs between 1980 and 1991, while the remaining 48% went on over-the-counter drugs. During the same period, expenditures on medication of both types grew at a real average annual rate of 10%. Figure 3, however, shows that on a yearly basis the growth rate for the two categories varied widely. Between 1980 and 1982 and between 1985 and 1987, expenditures on prescription drugs grew faster than on over-the-counter drugs; for all other years the reverse was true. Figure 4 shows total spending on medication by funding sector for 1980 and 1991. In Canada, the private sector (i.e., individuals or their insurance companies) pays most of these expenses. However, the private sector's relative contribution to paying for medication has declined somewhat, having gone from 77% in 1980 to 73% in 1991. This reduction in funding from the private sector was entirely made up by increased expenditures by the provincial governments, which went steadily from 21% of the total to 26% during this period. Provincial governments are paying for an increasing share of all medication bought, though this trend may be reversed, since most of the provinces have modified their drug insurance plans either by restricting the list of eligible products or by imposing user fees. Federal expenditures on medication have always been minimal, restricted as they are to medication for special groups, such as veterans and members of the Forces. The share of costs borne by the various workers' compensation boards has also remained stable since 1980. COMPARISONS WITH OTHER OECD COUNTRIES A common trend with respect to medication is perceptible among the OECD countries. Like Canada, the other member states are spending more than before on medication, but there are significant differences in the overall level of expenditure. Figure 5, for example, shows that Germany devotes almost 22% of its total health-care spending to the purchase of medication while Sweden and the United States devote only 8%. Canada is roughly in the middle. Spending trends for medication in the OECD countries have not been uniform, while spending on medication as a proportion of total health-care spending has increased in Canada, France, Germany, Italy and Sweden, it has decreased in Japan and the United States. Figure 6 shows that the public sector's relative share in paying the total cost of medication also varies among the different OECD countries. For example, in 1991 the public sector financed 84% of total spending on medication in Sweden, as against 12% in the United States. Nor have patterns of public-sector spending been the same everywhere in the past decade. The proportion of public funding for such expenditures has increased in Canada, the United Kingdom and the United States, decreased in France, Germany and Italy, and remained stable in Sweden. The considerable differences in the levels of public financing reflect country-to-country variations in the proportion of the population covered by public drug-insurance plans, the characteristics of the different populations, and the contribution of patients or consumers. In Canada and the United States, public drug-insurance programs are designed for special groups, such as the elderly and recipients of social assistance. In the other countries, almost the entire population is eligible for such coverage. CAUSES OF INCREASED SPENDING ON MEDICATION A number of factors explain the increased spending on medication. On the demand side we see higher numbers of people taking medication more frequently; this is partly because of an increase in the number of elderly people, who are heavier consumers of medication, and partly because use of medication is more widespread in all age groups. This has come about partly as the result of doctors' prescribing more drugs, so that individuals of all ages are consuming more than they used to. On the supply side there are two factors worth considering. Drug prices have gone up in real terms over the past decade, particularly between 1980 and 1988, and the arrival of new drugs on the market has accentuated upward pressures on prices, since the pharmaceutical companies tend to demand high prices when launching a new product. The other factor is that dispensing fees have risen enough to push up the overall cost of medication in Canada. It seems unlikely that spending on medication will go down in the future. This is because first, the number of elderly people will continue to increase, and second, because newly developed drugs will continue to be highly priced. Increasingly, Canada and the other OECD countries are recognizing that the prescription of medication that is both clinically AND economically effective, together with appropriate levels of consumption by the population as a whole, may be the approach that will slow down the increase in spending on medication. Figure 1 Spending on Medication in Canada, 1980-1991
|
