BP-438E
PUBLIC-
AND PRIVATE-SECTOR INVOLVEMENT
IN HEALTH-CARE SYSTEMS:
A COMPARISON OF OECD COUNTRIES
Prepared by:
Claude Blanchette, Erin Tolley, Economics Division
May 1997
Revised February 2001
TABLE
OF CONTENTS
DEFINING "PUBLIC" AND "PRIVATE"
THE ROLE OF THE PUBLIC SECTOR IN HEALTH CARE
THE ORGANIZATION OF HEALTH-CARE SYSTEMS
C. Public and Private Delivery
THE COMPARATIVE APPROACH AND DOMESTIC POLICY-MAKING
HEALTH-CARE SPENDING TRENDS IN OECD COUNTRIES: AN OVERVIEW
FINANCING HEALTH CARE IN OECD COUNTRIES
DELIVERING HEALTH CARE IN OECD COUNTRIES
RESOURCE ALLOCATION: SERVICE RATIONING
WHAT CAN WE EXPECT IN THE FUTURE?
PUBLIC- AND PRIVATE-SECTOR
INVOLVEMENT
IN HEALTH-CARE SYSTEMS:
A COMPARISON OF OECD COUNTRIES(1)
At the end of the Second World War, Canada and several other countries introduced significant measures to build health-care systems that would meet the public’s changing needs and demands. During this time, health care became universally accessible in many countries, and health-care spending accounted for an increasingly large proportion of the gross domestic product (GDP).(2) As a result, the range of publicly funded health services grew, hospital infrastructure improved, and the use of new medical technologies significantly increased the number of diseases that could be successfully treated. This trend, however, would change. The oil crisis in the 1970s, the recession in the 1980s, and the desire to balance governments’ budgets in the 1990s necessitated changes in response to the rising costs of health care.
Changes were introduced to contain costs and enable health-care resources to be used more efficiently. In general, these changes have meant reduced public coverage, decreased publicly funded health services, and increased out-of-pocket payments. Although the rate of growth in private-sector spending in health care was decreasing in the 1960s and 1970s, it began to exceed public-sector spending in many countries, including Canada, in the 1980s and 1990s. There is now greater involvement by the private sector in health care. Increasingly, the public and private sectors are working conjointly to fund and deliver health services.
This paper will examine public- and private-sector involvement in health care in the member countries of the Organisation for Economic Co-operation and Development (OECD). Using examples from the OECD countries, the first part of the paper discusses the organization of health-care systems and the role of the public and private sectors in financing and delivering health care. Following a few remarks about the comparative method of analysis, the second part of the paper provides an overview of health-care spending in OECD countries from 1960 to the present. The next sections examine health-care financing, delivery and resource allocation in OECD countries with a particular focus on the increasing involvement of the private sector. After a section on expectations for the future, the paper makes some concluding remarks.
DEFINING "PUBLIC" AND "PRIVATE"
The terms “public” and “private,” although not precise, are often used as descriptors for health-care systems. In general, “public” refers to government involvement, while “private” may refer to involvement by businesses, charitable organizations or individuals. This categorization is illustrated in Table 1.
Table 1
Categories of Public and Private
|
Category |
Levels |
|
Public |
|
|
|
|
|
|
|
|
|
|
|
Private |
|
|
|
|
|
|
|
|
|
|
Source: Raisa Deber et al., “The Public-Private Mix in Health Care,” Striking a Balance: Health Care Systems in Canada and Elsewhere, paper commissioned by the National Forum on Health, MultiMondes, 1998, p. 433.
Although Table 1 presents the public and private sectors as separate entities, the two are often closely related. For example, even when hospital services are delivered by charitable organizations (the private sector), the responsibility to do so is typically delegated by the government (the public sector). Governments frequently regulate private-sector involvement, as with the German Sickness Funds, or they may provide additional funding, as with the substantial government (public) subsidization of the U.S. health-care system, which is typically described as private.
THE ROLE OF THE PUBLIC SECTOR IN HEALTH CARE
Public-sector involvement in health care dates back to 1883 when compulsory sickness insurance was introduced in Germany for some categories of workers. This established the first model of mandatory health-care insurance in the Western world. Almost all industrialized countries now have health-care systems in which there is a high level of public-sector involvement. Nonetheless, there is little consensus between economists about the precise role that the public sector should play in financing and delivering health care. Some of the arguments for public-sector involvement in health care include social justice, restriction of monopolies, redistribution and public goods.(3) These arguments may overlap.
The social justice argument applies to situations in which the provision of health services to one person is advantageous for other members of society. For example, the treatment of an infectious disease provides a broad societal benefit. From a social standpoint, public-sector delivery of these types of health services may be preferred to private-sector delivery because when the price of a service is determined privately, it may not incorporate the positive external social benefits of delivering it. As a result, the price may be higher when it is determined privately. If the price exceeds what people can afford, or are willing, to pay, they will forego the treatment. This may have undesirable social consequences. For example, an infectious disease may spread to a broad segment of society.
The second argument is that government involvement in health care prevents health-care providers from exercising a monopoly. In a health-care monopoly, the medical profession is able to control access to training or impose restrictions on medical substitutes. This can restrict the availability of services.
The redistribution argument asserts that public-sector involvement permits the redistribution of funds from people who are in good health to people who are in poor health. Individuals are not equally afflicted with health problems. People with unhealthy lifestyles or dangerous jobs, for example, have a higher risk of developing health problems. In a private insurance system, these people would pay a higher premium, but in a public insurance system, the risks are pooled and everyone pays the same premium, regardless of the risk for filing a claim. In the public model, insurance must be mandatory, otherwise those at low risk would almost certainly opt out. In the private model, insurance is voluntary and insurers may choose who they wish to insure. In some cases, people in poor health may have difficulty finding an insurer who is willing to cover them. Figure 1 depicts the health-care funding, risk pooling, and insurance coverage patterns in selected countries.
The public goods argument in favour of public-sector involvement in health care suggests that health care is a public good in the sense that it “cannot be managed by market mechanisms because it is impossible to exclude people who have not paid from consuming it.”(4) Clean air and military defence are two other examples of public goods. There is a consensus that governments have a legitimate economic role and responsibility to fund and deliver public goods.
Figure 1
Funding, Risk Pooling and Insurance Coverage
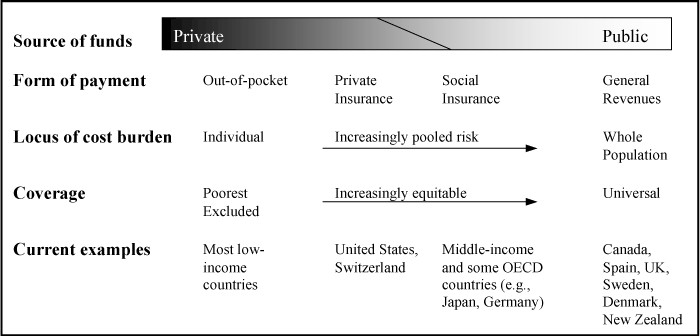
Source: World Health Organization, The World Health Report 1999, WHO, 1999, p. 41.
In recent years, concerns about cost containment, quality, and accessibility to health services have prompted calls for health-care reform in many countries. As a means of addressing these concerns, public-sector involvement in health care has decreased, permitting increased involvement by the private sector in health care in many countries. Proponents argue that private-sector involvement in health-care systems encourages greater efficiency, innovation, consumer choice, and client responsiveness.(5) However, Deber et al. argue:
Most reasons advanced in favour of allowing competing insurers or financers appear to be based on ideology rather than evidence. The primary justification is usually based on the assumptions that markets promote efficiency and that competition is more responsive to innovation and patient choice. There is good justification for these arguments when speaking of delivery, but none when speaking of financing.(6)
Other critics argue that greater private-sector involvement will lead to inequities in access and eroded standards of care.(7)
THE ORGANIZATION OF HEALTH-CARE SYSTEMS
In its simplest form, a health-care system contains two components: financing and delivery. Financing refers to the generation of funds to pay for health services, while delivery refers to the provision of health services. Financing and delivery can be carried out in the public sector, the private sector, or both. As such, a variety of financing and delivery options are available. Table 2 illustrates the possible combinations for public- and private-sector involvement in financing and delivering health care, drawing on examples from the OECD countries. A more detailed discussion of these options follows.
The precise organization of a health-care system is much more complex than Table 2 implies. Most countries use a mix of financing and delivery options from both the public and the private sector, although the private-sector component is typically small. As Deber et al. point out, “Virtually every country employs some combination of financing and delivery models, relying on various public-private combinations in various sectors of the health-care system or for various groups of the nation’s population.”(8) Moreover, health-care systems are dynamic; changing needs, new policy directions, and medical developments may all necessitate health-care reform. As a result, it is quite difficult to place health-care systems into static compartments.
Table 2
Private- and Public-Sector Involvement in Health Care
|
DELIVERY |
|||
|
Public |
Private |
||
|
|
|
|
|
|
|
|
|
|
In publicly financed systems, there is considerable government involvement in funding health services. There are two types of public financing: (1) tax-based financing; and (2) social security financing.
In a tax-based model, access to health services is, in theory, independent of one’s ability to pay. In this model, health care is financed primarily through taxation; and everyone enjoys the same level of public coverage, regardless of their risk factors and level of taxation. Taxes are collected by the government, which then delivers the services, as in Sweden, or pays others to do so, as in Canada. Typically in these systems, no user charges are collected for publicly insured health services. Even in tax-based schemes, however, there are some financing variations. For example, New Zealand uses general tax revenues to finance its system, but in Australia, the National Health Insurance is funded through a mixture of general tax revenue, a levy on taxable income, state revenues, and fees paid by patients. In the United Kingdom, the National Health Service is funded through a mixture of general taxation and national insurance contributions. Other countries that use tax-based financing as the primary source of health-care funding are Denmark, Finland and Ireland.
Social security financing schemes are funded by premiums collected through “sickness funds.” Membership in a sickness fund is compulsory and the premium is generally based on a percentage of an individual’s wage. The sickness funds are managed by a number of social partners (e.g., employers, professional groups and regions) and are subject to stringent government regulation and monitoring. Because of this partnership between the government and others, the social security model for financing health care is sometimes referred to as “quasi-public” financing. Austria, Belgium, Japan, France, Germany, the Netherlands and Luxembourg fund their health-care systems primarily through social security.
Essentially, there are two categories of private financing: (1) private insurance; and (2) out-of-pocket payments. The latter category includes several forms of private payment. For example, in private insurance schemes, co-insurance and deductibles are types of out-of-pocket payments.(9) In public insurance schemes, out-of-pocket payments may include extra billing or user fees.(10) A final type of out-of-pocket payment occurs when services are partially covered, or not covered at all, by either the public or private insurance plan. In these cases, the patients must pay the full cost of the health service.
Although some type of private financing is used in all OECD countries, the revenue generated in this way remains a small portion of total health-care spending, except in the United States where private financing is significant. Nonetheless, some observers have noted that with the recent emphasis on cost-effectiveness, these methods of financing have become increasingly common.(11)
Indeed, some health economists assert that if individuals are required to pay directly for a portion of their own health services, they will take steps to prevent illness and their use of health services. As such, it is believed that private financing will reduce incidences of under-prevention or overuse. For example, dental care is not covered under Canada’s public health-care system. This may encourage people to develop better oral hygiene. Limiting the number of eye examinations covered under the public plan, as in Canada, restricts the availability of this service and reduces costs, although perhaps not to the benefit of patients’ health.
Some observers, however, contest this application of economic theory to health care, noting “free-of-charge services do not translate automatically into unjustified over-utilization of services.”(12) In the first place, they argue that it is unlikely that people will “abuse their health solely because they will not have to pay for resulting care.”(13) Second, they suggest that these arrangements disproportionately affect the poor. In their view, there is a correlation between poverty and poor health; the poor require health care more frequently, and they are less able to pay for the services out of their own pockets. For this reason, many countries exempt low-income earners from cost-sharing arrangements. This is the case in the United States where Medicare and Medicaid provide coverage for the elderly and the poor. Despite public coverage for these groups of people, it is estimated that “around 60 percent of those below the federally defined poverty line are ineligible” for coverage in the United States.(14)
When private insurance is used to finance health services, patients pay a premium and are usually required to pay a deductible or co-insurance. The insurer covers the remaining costs. Participation in a private insurance scheme is voluntary and premiums are typically based on the insuree’s level of risk.
The United States is the only OECD country that relies primarily on private insurance for health-care financing, but in many OECD countries, private insurance either supplements or competes with publicly funded health care. For example, in the United Kingdom, individuals are permitted to purchase private insurance coverage for services that are covered under public health-care insurance, as long as the service is provided by the private sector. In Holland and Germany, private insurance is an alternative to public insurance; those who have private insurance are exempt from the payroll taxes that finance public plans. These plans cover the majority of the population in both countries. By contrast, in Canada, provincial legislation prohibits private insurance for services covered under public health-care insurance, but private insurance is available for services that are not publicly insured, such as drugs, dental care and eye care.
Out-of-pocket payments involve payment, by the patient, of a fee charged for the provision of health services. As noted above, out-of-pocket payments may be required in both private insurance schemes and public health-care insurance plans.
In Canada, legislation prohibits the use of user charges or extra billing for services that are publicly insured. For services that are not publicly insured, user charges may be levied, but infrequently. User charges are widely used in OECD countries. In both Sweden and France, where public coverage is broader than in Canada, user charges are applied to physician services, drugs and dental care. In Germany, patients are assessed a fee, approximately $15 Canadian, for hospitalization. In Japan, co-payments are charged for all medical bills, physicians’ bills, inpatient care, pathology, pharmaceuticals and X-rays, although various government subsidies exist and fees are adjusted based on income. Extra billing is not common in OECD countries. Australia and Finland do permit this practice, but with protections for low-income families.
The highest out-of-pocket payments are incurred when there is no form of insurance to cover the cost of health services. In these cases, patients pay for the service in its entirety. For example, although Canadians do not incur any out-of-pocket payments for publicly insured health services, certain services – dental care, eye care and prescription drugs – are not publicly insured. It has been estimated that approximately 12% of Canadians do not have a drug insurance plan and therefore must pay the full cost of their prescription drugs. In 1999, in the United States, some 44 million people – 16% of the population – did not have health-care coverage.(15)
C. Public and Private Delivery
Publicly delivered health care is provided by non-profit public-sector practitioners in publicly owned facilities. Funding for these systems typically comes from the public sector. Denmark and Norway are examples of countries that deliver the majority of health services in this way, although a portion of services in all OECD countries are publicly owned and publicly delivered.
In privately delivered systems, services are provided by private practitioners, either commercial or non-profit, in privately owned facilities. Canada delivers most health care in non-profit settings, as do the United Kingdom and the Netherlands. Funding for these systems may come from the public sector or the private sector. By contrast, the United States relies extensively on private, for-profit delivery of health care.
THE COMPARATIVE APPROACH AND DOMESTIC POLICY-MAKING
The comparative analysis of social policies, or “cross-border learning,” has grown rapidly in recent years. In the context of health-care systems, Marmor and Okma argue that the growth of comparative analysis is linked to three developments:
-
funding for health care is a major expenditure in most developed welfare states, and the fiscal strain of the 1980s and 1990s resulted in greater policy scrutiny;
-
the maintenance of existing programs has taken priority over bold fiscal expansion; and
-
the post-war consensus on the welfare state is eroding.(16)
These developments have necessitated new approaches to health-care delivery, financing and policy. As there is no “laboratory” in which to test new social policy ideas, the practices and policies of other countries have at times been used to generate domestic policy. Nonetheless, as Marmor and Okma point out, “there is much ill-advised ‘cross-border shopping.’ ”(17) Therefore, comparative analyses should be interpreted and used with caution. The specificity of local conditions, stakeholders and institutions requires that policy-makers generate policy solutions that fit within the context of each country.
Numerical comparative data demand an even greater level of caution. When compiling health-care data, countries may use different methods to report, record and calculate these figures. Not only may countries differ in terms of the items that they exclude and include in their reports, but the way that variables are defined may differ as well. As such, comparative numerical data should be used as guidelines for assessing trends, rather than as precise indicators of similarity and difference.
HEALTH-CARE SPENDING TRENDS IN OECD COUNTRIES: AN OVERVIEW
In order to contextualize health-care spending in relation to overall economic growth, health-care expenditures are often reported as a percentage of GDP. In general, health-care expenditures increase as GDP increases. However, caution is advised. For example, if one examines health-care expenditures as a proportion of GDP during a recession, there is the illusion of growth. This is because during times of economic recession, health-care expenditures remain relatively stable while GDP decreases, making it appear as though there has been growth in health-care spending. Nonetheless, the relationship between health-care expenditures and GDP is the most commonly used comparator. It would be inappropriate, and difficult, to define a “correct” level of health-care funding, but the World Health Organization suggests that “while spending much more than 9% of GDP may indicate macroeconomic inefficiency, countries spending less than 2% are almost certainly investing too little in health.”(18)
Table 3 shows the level of health-care spending as a proportion of GDP in OECD countries. When examining total health-care expenditures, two trends are apparent. First, in the 1960s and 1970s, spending on health care increased dramatically in most OECD countries. Second, throughout the 1980s and 1990s, health-care spending slowed, or decreased, in most countries. Indeed, between 1960 and 1980, health-care spending as a proportion of GDP grew by 2.9 percentage points; between 1980 and 1998, health-care spending as a proportion of GDP grew by only 1.4 percentage points, half the rate of growth experienced in the previous two decades.
In Canada, the rate of growth in health-care spending was the fastest in the 1960s and 1980s; it was slower in the 1970s and the 1990s. In the late 1990s, health-care spending as a proportion of GDP has changed only marginally in relation to GDP. This is consistent with most other OECD countries. Even in the United States, where health-care spending in relation to GDP has been increasing since the 1960s, between 1995 and 1999, health-care spending declined in relation to GDP. Clearly, cost control has become a key plank in the health-care policies of most OECD countries.
Table 3
Total Health-Care Spending as a Percentage of GDP
|
1960 |
1965 |
1970 |
1975 |
1980 |
1985 |
1990 |
1992 |
1994 |
1996 |
1997 |
1998 |
1999 |
|
| Australia |
4.7 |
4.9 |
5.4 |
7.2 |
7 |
7.4 |
7.9 |
8.2 |
8.2 |
8.3 |
8.3 |
8.5 |
– |
| Austria |
4.3 |
4.6 |
5.3 |
7.2 |
7.7 |
6.7 |
7.2 |
7.6 |
8.1 |
8.9 |
8.2 |
8.2 |
8.3 |
| Belgium |
3.4 |
3.9 |
4.1 |
5.9 |
6.4 |
7.2 |
7.4 |
7.9 |
7.9 |
8.6 |
8.6 |
8.8 |
– |
| Canada |
5.4 |
5.9 |
7 |
7.2 |
7.2 |
8.4 |
9.2 |
10.2 |
9.8 |
9.4 |
9.3 |
9.5 |
9.5 |
| Czech. Rep. |
– |
– |
– |
– |
3.8 |
4.5 |
5 |
5.4 |
7.3 |
7.0 |
7.1 |
7.2 |
7.6 |
| Denmark |
3.6 |
– |
– |
– |
9.2 |
8.8 |
8.4 |
8.4 |
8.5 |
8.3 |
8.2 |
8.3 |
8.3 |
| Finland |
3.9 |
4.9 |
5.7 |
6.2 |
6.4 |
7.2 |
7.9 |
9.1 |
7.8 |
7.7 |
7.3 |
6.9 |
– |
| France |
4.2 |
5.2 |
5.8 |
7 |
7.4 |
8.3 |
8.8 |
9.2 |
9.6 |
9.7 |
9.6 |
9.6 |
9.5 |
| Germany |
– |
– |
6.3 |
8.8 |
8.8 |
9.3 |
8.7 |
9.7 |
9.8 |
10.6 |
10.5 |
10.6 |
10.5 |
| Greece |
3.1 |
– |
5.7 |
– |
6.6 |
– |
7.6 |
8.3 |
8.3 |
8.3 |
8.5 |
8.3 |
– |
| Hungary |
– |
– |
– |
– |
– |
– |
– |
7.8 |
8.2 |
7.2 |
6.9 |
6.8 |
– |
| Iceland |
3.3 |
3.9 |
5 |
5.8 |
6.2 |
7.3 |
8 |
8.2 |
8.1 |
8.1 |
7.9 |
8.3 |
8.4 |
| Ireland |
3.8 |
4.2 |
5.3 |
7.7 |
8.7 |
7.9 |
7 |
7.8 |
7.7 |
7.2 |
7.0 |
6.4 |
6.1 |
| Italy |
3.6 |
4.3 |
5.2 |
6.2 |
7 |
7.1 |
8.1 |
8.5 |
8.4 |
8.1 |
8.4 |
8.4 |
8.4 |
| Japan |
3 |
4.5 |
4.6 |
5.6 |
6.5 |
6.7 |
6.1 |
6.3 |
6.9 |
7.1 |
7.4 |
7.6 |
– |
| Korea |
– |
– |
1.9 |
2 |
3.4 |
4.3 |
4.8 |
4.8 |
4.6 |
4.9 |
5.0 |
5.0 |
– |
| Luxembourg |
– |
– |
3.7 |
5.1 |
6.2 |
6.1 |
6.6 |
6.6 |
6.5 |
6.4 |
6.0 |
5.9 |
– |
| Mexico |
– |
– |
– |
– |
– |
– |
3.6 |
4.4 |
4.7 |
4.6 |
4.7 |
– |
– |
| Netherlands |
– |
– |
– |
7.9 |
8.3 |
8.1 |
8.8 |
9.2 |
9.2 |
8.8 |
8.6 |
8.6 |
– |
| New Zealand |
4.3 |
– |
5.2 |
6.7 |
6 |
5.3 |
7 |
7.6 |
7.3 |
7.3 |
7.6 |
8.1 |
– |
| Norway |
2.9 |
3.5 |
4.5 |
6 |
7 |
6.7 |
7.8 |
8.2 |
8.0 |
8.0 |
8.1 |
8.9 |
8.6 |
| Poland |
– |
– |
– |
– |
– |
– |
5.3 |
6.6 |
6.0 |
6.4 |
6.2 |
6.4 |
6.3 |
| Portugal |
– |
– |
2.8 |
5.6 |
5.8 |
6.3 |
6.4 |
7.2 |
7.5 |
7.7 |
7.6 |
7.8 |
– |
| Spain |
1.5 |
2.6 |
3.7 |
4.9 |
5.6 |
5.7 |
6.9 |
7.4 |
7.4 |
7.1 |
7.0 |
7.1 |
– |
| Sweden |
4.7 |
5.5 |
7.1 |
7.9 |
9.4 |
9 |
8.8 |
8.8 |
8.6 |
8.7 |
8.5 |
8.4 |
– |
| Switzerland |
3.1 |
3.6 |
4.9 |
6.6 |
6.9 |
7.7 |
8.3 |
9.3 |
9.5 |
10.1 |
10.3 |
10.4 |
– |
| Turkey |
– |
– |
2.4 |
2.7 |
3.3 |
2.2 |
3.6 |
3.8 |
3.6 |
3.8 |
4.0 |
– |
– |
| United King. |
3.9 |
4.1 |
4.5 |
5.5 |
5.7 |
5.9 |
6 |
6.9 |
7.0 |
7.0 |
6.7 |
6.7 |
7.0 |
| United States |
5.1 |
5.7 |
7.1 |
8 |
8.9 |
10.4 |
12.4 |
13.6 |
13.9 |
13.8 |
13.6 |
13.6 |
13.7 |
| OECD Average |
3.79 |
4.46 |
4.91 |
6.26 |
6.73 |
7.0 |
7.29 |
7.83 |
7.86 |
7.9 |
7.83 |
8.15 |
8.63 |
(–) = insufficient data
Source: OECD, OECD Health Data 2000: A Comparative Analysis of 29 Countries, CD-ROM.
FINANCING HEALTH CARE IN OECD COUNTRIES
This was not always the case. In the decades following the Second World War, health-care spending in all OECD countries increased dramatically, as did government involvement in health care. As Table 4 shows, in the OECD countries for which sufficient data exist, public spending on health care (as a proportion of GDP) increased 2.8 percentage points between 1960 and 1980, while private-sector spending increased by only 0.2 percentage point in the same period. In Canada, the comparison is even more striking: while public spending increased by 3.1 percentage points between 1960 and 1980, private spending decreased 1.3 percentage points and did not begin to rise again until the 1980s. The strong growth in health-care spending in Canada and elsewhere during the 1960s was largely a result of growth in the public sector.
Table 4
Public- and Private-Sector Health-Care Spending as a Percentage of GDP
| 1960 | 1970 | 1980 | 1990 | 1998 | ||||||
| Public | Private | Public | Private | Public | Private | Public | Private | Public | Private | |
| Australia |
2.2 |
2.5 |
3.6 |
1.8 |
4.3 |
2.7 |
5.3 |
2.6 |
5.9 |
2.6 |
| Austria |
3 |
1.3 |
3.4 |
1.9 |
5.3 |
2.4 |
5.3 |
1.9 |
5.8 |
2.4 |
| Belgium |
2.1 |
1.3 |
3.5 |
0.6 |
5.4 |
1 |
6.6 |
0.8 |
7.9 |
0.9 |
| Canada |
2.3 |
3.1 |
4.9 |
2.1 |
5.4 |
1.8 |
6.8 |
2.4 |
6.6 |
2.9 |
| Czech Rep. |
– |
– |
– |
– |
3.7 |
0.1 |
4.8 |
0.2 |
6.6 |
0.6 |
| Denmark |
3.2 |
0.4 |
– |
– |
8 |
1.1 |
7 |
1.4 |
6.8 |
1.5 |
| Finland |
2.1 |
1.8 |
4.2 |
1.5 |
5 |
1.4 |
6.4 |
1.5 |
5.3 |
1.6 |
| France |
2.4 |
1.8 |
4.3 |
1.5 |
5.8 |
1.6 |
6.7 |
2.1 |
7.2 |
2.3 |
| Germany |
3.2 |
1.6 |
4.6 |
1.7 |
6.9 |
1.9 |
6.7 |
2 |
7.9 |
2.7 |
| Greece |
1.5 |
1.6 |
2.4 |
3.3 |
3.7 |
2.9 |
4.8 |
2.8 |
4.7 |
3.6 |
| Hungary |
– |
– |
– |
– |
– |
– |
– |
– |
5.2 |
1.6 |
| Iceland |
2.5 |
0.8 |
4.1 |
0.9 |
5.5 |
0.7 |
6.9 |
1.1 |
7 |
1.3 |
| Ireland |
2.9 |
0.9 |
4.3 |
1 |
7.1 |
1.6 |
5 |
2 |
4.8 |
1.6 |
| Italy |
3 |
0.6 |
4.5 |
0.7 |
5.6 |
1.4 |
6.3 |
1.8 |
5.6 |
2.8 |
| Japan |
1.8 |
1.2 |
3.2 |
1.4 |
4.6 |
1.9 |
4.7 |
1.4 |
6 |
1.6 |
| Korea |
– |
– |
0 |
1.9 |
0.7 |
2.7 |
1.7 |
3.1 |
2.3 |
2.7 |
| Luxembourg |
– |
– |
3.3 |
0.4 |
5.7 |
0.5 |
6.1 |
0.5 |
5.4 |
0.5 |
| Mexico |
– |
– |
– |
– |
– |
– |
2.1 |
1.5 |
– |
– |
| Netherlands |
– |
– |
5 |
– |
5.9 |
2.4 |
6.1 |
2.7 |
6 |
2.6 |
| New Zealand |
3.5 |
0.8 |
4.2 |
1 |
5.3 |
0.7 |
5.8 |
1.2 |
6.2 |
1.9 |
| Norway |
2.3 |
0.6 |
4.1 |
0.4 |
5.9 |
1.1 |
6.5 |
1.3 |
7.1 |
1.5 |
| Poland |
– |
– |
– |
– |
– |
– |
4.8 |
0.5 |
4.2 |
2.2 |
| Portugal |
– |
– |
1.6 |
1.2 |
3.7 |
2.1 |
4.2 |
2.2 |
5.2 |
2.6 |
| Spain |
0.9 |
0.6 |
2.4 |
1.3 |
4.5 |
1.1 |
5.4 |
1.5 |
5.4 |
1.7 |
| Sweden |
3.4 |
1.3 |
6.1 |
1 |
8.7 |
0.7 |
7.9 |
0.9 |
7 |
1.4 |
| Switzerland |
1.9 |
1.2 |
3.1 |
1.8 |
4.6 |
2.3 |
5.7 |
2.6 |
7.7 |
2.7 |
| Turkey |
– |
– |
0.9 |
1.5 |
0.9 |
2.4 |
2.2 |
1.4 |
– |
– |
| United King. |
3.3 |
0.6 |
3.9 |
0.6 |
5.1 |
0.6 |
5.1 |
0.9 |
5.6 |
1.1 |
| United States |
1.2 |
3.9 |
2.6 |
4.5 |
3.7 |
5.2 |
4.9 |
7.5 |
6.1 |
7.5 |
| OECD Average |
2.2 |
1.5 |
3.5 |
1.5 |
5.0 |
1.7 |
5.4 |
1.9 |
6.0 |
2.2 |
(–) = insufficient data
Source: OECD, OECD Health Data 2000.
A period of slow economic growth and a deterioration of public finances resulted in decreasing growth in public health-care spending in the 1970s and 1980s in many countries. This decline in the rate of growth of public financing was accompanied by growth in private-sector financing, a trend that has continued in the 1990s. Between 1960 and 1980, private-sector spending on health care as a proportion of GDP increased by 0.2 percentage point; from 1980 to 1998, private-sector spending on health as a proportion of GDP increased by 0.5 percentage point. In Canada, private-sector spending as a proportion of GDP decreased during the 1960s and 1970s, but it increased during the 1980s and 1990s. This is shown in Table 5.
Table 5
Health-Care Spending as a Percentage of GDP,
Change Expressed in Percentage Points
|
1960 |
1960-69 |
1970-79 |
1980-89 |
1990-98 |
1998 |
|||||||
|
Public |
Private |
Public |
Private |
Public |
Private |
Public |
Private |
Public |
Private |
Public |
Private |
|
| Australia |
2.2 |
2.5 |
0.6 |
-0.3 |
0.7 |
0.9 |
0.8 |
-0.3 |
0.6 |
0 |
5.9 |
2.6 |
| Austria |
3 |
1.3 |
0.6 |
0.4 |
1.8 |
0.5 |
0.1 |
-0.5 |
0.5 |
0.5 |
5.8 |
2.4 |
| Belgium |
2.1 |
1.3 |
1.3 |
-0.8 |
2.1 |
0.6 |
1.2 |
-0.2 |
1.3 |
0.1 |
7.9 |
0.9 |
| Canada |
2.3 |
3.1 |
2.3 |
-1.1 |
0.4 |
-0.4 |
1.1 |
0.4 |
-0.2 |
0.5 |
6.6 |
2.9 |
| Czech Rep. |
– |
– |
– |
– |
– |
– |
0.5 |
0.1 |
1.8 |
0.4 |
6.6 |
0.6 |
| Denmark |
3.2 |
0.4 |
2.0 |
0.5 |
0.6 |
0.1 |
-0.8 |
0.3 |
-0.2 |
0.1 |
6.8 |
1.5 |
| Finland |
2.1 |
1.8 |
2.2 |
-0.3 |
0.8 |
-0.1 |
0.8 |
0 |
-1.1 |
0.1 |
5.3 |
1.6 |
| France |
2.4 |
1.8 |
1.7 |
-0.1 |
1.3 |
0.1 |
0.6 |
0.5 |
0.5 |
0.2 |
7.2 |
2.3 |
| Germany |
3.2 |
1.6 |
1.1 |
-0.1 |
2.1 |
0.1 |
-0.2 |
0.2 |
1.2 |
0.7 |
7.9 |
2.7 |
| Greece |
1.5 |
1.6 |
– |
– |
– |
– |
1 |
-0.1 |
-0.1 |
0.8 |
4.7 |
3.6 |
| Iceland |
2.5 |
0.8 |
1.8 |
0.1 |
1.5 |
-0.3 |
1.8 |
0.5 |
0.1 |
0.2 |
7 |
1.3 |
| Ireland |
2.9 |
0.9 |
0.8 |
0.4 |
2.2 |
0.4 |
-2.4 |
0.3 |
-0.2 |
-0.4 |
4.8 |
1.6 |
| Italy |
3 |
0.6 |
1.3 |
0 |
0.8 |
0 |
0.3 |
0.4 |
-0.7 |
1 |
5.6 |
2.8 |
| Japan |
1.8 |
1.2 |
1 |
0.6 |
1.3 |
0.2 |
0.2 |
-0.5 |
1.3 |
0.2 |
6 |
1.6 |
| Korea |
– |
– |
– |
´– |
0.5 |
0.6 |
0.8 |
0.6 |
0.6 |
-0.4 |
2.3 |
2.7 |
| Luxembourg |
– |
– |
– |
– |
2.3 |
0 |
0 |
0 |
-0.7 |
0 |
5.4 |
0.5 |
| Netherlands |
– |
– |
– |
– |
0.8 |
– |
0.1 |
0.4 |
-0.1 |
-0.1 |
6 |
2.6 |
| New Zealand |
3.5 |
0.8 |
0.4 |
0.5 |
1.3 |
0.1 |
0.3 |
0.3 |
0.4 |
0.7 |
6.2 |
1.9 |
| Norway |
2.3 |
0.6 |
1.4 |
-0.2 |
1.9 |
-0.2 |
0.6 |
0.1 |
0.6 |
0.2 |
7.1 |
1.5 |
| Portugal |
– |
– |
– |
– |
1.8 |
0.4 |
-0.3 |
0.9 |
1 |
0.4 |
5.2 |
2.6 |
| Spain |
0.9 |
0.6 |
1.2 |
0.7 |
2 |
-0.2 |
0.6 |
0.3 |
0 |
0.2 |
5.4 |
1.7 |
| Sweden |
3.4 |
1.3 |
2.4 |
-0.2 |
2.1 |
-0.2 |
-0.8 |
0.2 |
-0.9 |
0.5 |
7 |
1.4 |
| Switzerland |
1.9 |
1.2 |
1.2 |
0.6 |
1.5 |
0.4 |
1.1 |
0.3 |
2 |
0.1 |
7.7 |
2.7 |
| United King. |
3.3 |
0.6 |
0.5 |
0 |
0.8 |
0 |
-0.1 |
0.3 |
0.5 |
0.2 |
5.6 |
1.1 |
| United States |
1.2 |
3.9 |
1.2 |
0.3 |
0.8 |
0.6 |
0.9 |
1.8 |
1.2 |
0 |
6.1 |
7.5 |
| OECD Average |
2.2 |
1.5 |
1.3 |
0.1 |
1.4 |
0.2 |
0.3 |
0.3 |
0.4 |
0.2 |
6.0 |
2.2 |
(–) = insufficient data. Hungary, Mexico, Poland and Turkey were excluded because of insufficient data.
Source: OECD Health Data 2000.
Significant growth has occurred in the private-sector financing of health care in most OECD countries in the past two decades. Nevertheless, health-care financing in most OECD countries remains largely a public responsibility. This is illustrated in Figure 2, which shows the proportion of health-care financing that comes from tax revenues, social security, and private insurance and other out-of-pocket payments. Public financing, through taxation and social security, is the primary source of funding for health care in seven of the eight countries shown, but private-sector contributions are used to finance health care in all of these countries. Private-sector financing as a proportion of all health-care funding is the highest in the United States and the lowest in the United Kingdom and Japan.
Figure 2
Proportion of Health-Care Funding Generated by Different Methods in
Selected Countries, 1998
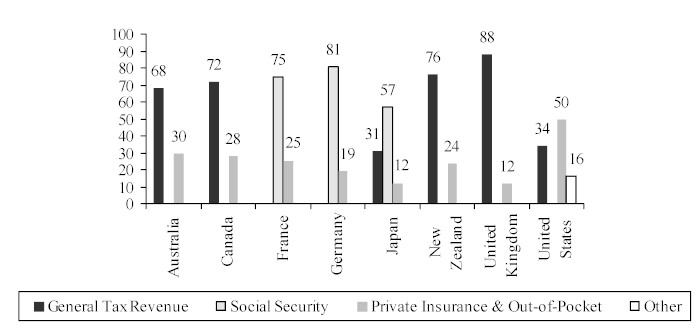
Source: Gerard F. Anderson and Peter Hussey, Health and Population Aging: A Multinational Comparison, The Commonwealth Fund, October 1999.
Accompanying the increasing prevalence of private-sector funding is the use of cost control strategies in OECD countries. Some of the measures that have been introduced include spending controls, budget limits on expenditures for new hospitals and expensive equipment, restrictions on the number of medical staff, and decreased volume of services. No two countries have adopted identical policies, but each of these reforms has one thing in common: they shift some of the responsibility for health-care funding and delivery away from the public sector and on to the private sector.(19)
Indeed, in her analysis of OECD countries in 1996, Susan MacPhee found that in the past two decades “most countries have altered the ways health care dollars are spent rather than how they are raised.”(20) She notes that major financing reforms have not been undertaken, or have been slow-moving, in most countries because of concerns about accessibility and the political implications of doing so. In order to maintain current levels of services, without significantly reforming health-care financing or increasing public funding, cost shifting has become a common strategy in OECD countries. Cost shifting can occur between the public and the private sectors, or between levels of government. In general, the cost-shifting initiatives that have been adopted in OECD countries have been on the delivery side of health care, rather than the financing side. Nevertheless, some countries have used strategies to shift costs on the financing side. These include increases to out-of-pocket payments, greater reliance on private insurance, and reducing public coverage of health services.
Out-of-pocket payments – through user fees, extra billing, deductibles, co-insurance, and reduced public coverage – are cost-shifting initiatives, as well as cost-sharing initiatives. Through cost sharing, patients bear a portion of the financing burden accrued through their use of health services. Cost-sharing initiatives are common in almost all OECD countries, but will vary depending on the service, the user and the country. Table 6 illustrates the cost-sharing arrangements in some OECD countries.
Table 6
Cost-Sharing Arrangements in Selected OECD Countries,
Description of Fees Charged to Patients
| ($ Cdn) |
Hospital Supplies |
Pharmaceutical Supplies |
Dental Services |
| Austria (1995) |
$9/day |
$5/prescription, except in cases of infectious disease or hardship; variable according to package size. |
25-50% of cost |
| Australia (1998) |
None |
$8-$48/prescription |
Up to $118/exam |
| Belgium (1995) |
$16/day |
Up to 75% of cost |
Up to 25% of cost |
| Canada (2000) |
None |
Varies
from province to province |
100% of cost |
| Denmark (1995) |
Only in unregistered private clinics |
25-50% of cost |
55-60% of cost |
| France (1995) |
35% of cost for the first 30 days |
35% of cost; 65% for minor illnesses; 100% for over-the-counter medications; no extra payment for chronic illnesses |
30% of cost |
| Germany (1997) |
$16 or $14/day |
$9-$13/pharmaceutical; 100% of cost for over-the-counter medications; variable according to package size |
Dentures: |
| Greece (1995) |
None |
10-25% of cost; no extra payment for chronic illnesses |
Dentures: |
| Ireland (1995) |
$48-$479/year (insured persons with high incomes only) |
$211/quarter of a year (insured persons with high incomes only); $81 if illness is chronic |
Dentures: |
| Italy (1995) |
None |
$5/prescription except for serious illnesses (50% of cost); numerous exceptions |
None |
| Netherlands (1997) |
None |
20% of cost |
Partial cost of dentures |
| Spain (1995) |
None |
40% of cost except for pensioners and the unemployed |
None |
| Sweden (1995) |
$15/day |
$29 for first prescribed medication; $11 for each additional medication |
30-75% of cost (varies according to dentist’s fee) |
| United Kingdom (1995) |
None |
$11 for each special prescribed medication, or $57 per quarter of a year, or $163 per year; variable according to social status; many exemptions |
20% of cost, up to $646; $8 for follow-up examination |
| United States |
Varies |
100% of cost |
100% of cost |
Source: Xenia Scheil-Adlung, “Steering the healthcare ship: Effects of market incentives to control costs in selected OECD countries,” International Social Security Review 51.1 (1998), pp. 112-113.
Although out-of-pocket payments are usually introduced to reduce public spending in health care, there is little evidence that they are an effective strategy for reducing total spending on health care. The assumption behind out-of-pocket payments is that they will decrease the use of health services, but as noted previously, this is open to debate. Moreover, some observers argue that multiple-payer systems, such as those that charge out-of-pocket fees, are less efficient than single-payer systems, such as those financed solely through government funding.(21) If the use of health services remains relatively stable and costs are charged directly to the patients, the overall cost of health care may increase, rather than decrease. Alternatively, if patients forego necessary treatment because they do not wish to pay directly for the service, greater costs may be incurred to treat the condition later on.
In addition, charging patients directly for services may increase administrative costs. For example, in New Zealand, user fees were set so high that people simply refused to pay their medical bills; the government was forced to lower the fees in the face of high collection costs.(22) In Italy, to avoid paying user fees, patients will ask to be hospitalized because medication and diagnostic tests are free in Italian hospitals.(23)
A second way that countries have shifted costs from the public sector to the private sector is to decrease public coverage of health services. Services no longer covered under the public plan must be paid for either through private insurance or out of the patient’s own pocket. In some cases, the treatment will be foregone altogether.
As this section has shown, health-care financing continues to be carried out primarily by the public sector, but private-sector financing has increased significantly in the past 20 years. According to some analysts, private-sector spending on health care in OECD countries may increase further in the coming years because of further reductions in public-sector spending, as well as demographic changes. In most OECD countries, the population aged 65 years and older is increasing, as is the average income among those in this age bracket. According to the OECD, per capita health-care expenditures for those 70 years of age and older are approximately double the average per capita health-care expenditures; expenditures for those 80 years of age and older are about four times higher than the average.(24) Moreover, the marginal propensity to use health care increases with income.(25) As the population of the over-65 age group increases and grows wealthier, the demand for health care will increase. This demand could be met by increasing the involvement of the private sector in financing and delivering health care. Other analysts believe that improving the efficiency and effectiveness of publicly funded health care is the best means of addressing the pressures of an aging population.
DELIVERING HEALTH CARE IN OECD COUNTRIES
As previously noted, significant reforms have been made to the ways in which countries deliver their health services. MacPhee suggests that these reforms have typically translated into greater private-sector involvement, with increased private delivery of health services being one of the most common strategies.(26) The trend toward increased private delivery is based on two assumptions. First, in health-care systems that are publicly financed and publicly delivered, consumer choice and satisfaction are believed to be low. Second, current health economics theory posits that competitive markets create greater monetary efficiency in health-care systems. As a result, most countries have attempted to promote greater micro-economic efficiency in their health-care systems.(27)
Although the Scandinavian countries have maintained publicly financed and publicly delivered health-care systems (often called “integrated systems”), many countries are moving to public-contract or reimbursement systems that combine public financing with private delivery. This type of system is used in Canada, Germany, Japan, the United Kingdom and most of the countries that have emerged from the former Soviet Union, among others.(28)
In addition, certain countries are moving away from an institutionalized approach to health care. Because hospital expenditures comprise a large portion of overall health-care spending, many countries are attempting to decrease hospitalization rates and the length of hospital stays. In general, this has affected the way that health care is delivered, with an increased emphasis on ambulatory care and outpatient care, as well as shifting responsibility for long-term care from hospitals to patients and their families.(29)
RESOURCE ALLOCATION: SERVICE RATIONING
In addition to the financing and delivery reforms introduced to promote greater efficiency, some countries have changed the way in which resources are allocated, a strategy that is often referred to as rationing. The Netherlands, New Zealand, Norway, Sweden and the United States are some of the OECD countries that have introduced rationing mechanisms into their health-care systems.(30) Rationing may take several forms. In some cases, the government will give each hospital a budget, with penalties for budget overruns and the imposition of measures to prevent the reallocation of revenue. In other cases, limits are placed on the number of new hospitals or efforts are made to discourage the proliferation of expensive medical equipment. Finally, direct controls may be applied to the number of staff, the volume of service, and rates of pay.(31)
These measures force health-care workers to operate using limited resources. In so doing, they attempt to improve the allocation of resources and to deliver health services more efficiently. In some countries, the limitation of services tended to shift demand and expenditures to service points with fewer restrictions. For example, in Canada and France, where physicians are paid by procedure, the cost of outpatient care has increased primarily because of the constraints on hospital spending. In other countries, where regulations permitted, budget constraints shifted the demand for health care to the private sector which, in some cases, spurred the growth of the private insurance market.(32) In Canada, private insurers offered Canadians health insurance so that they could get non-emergency care outside of the country.(33) In many countries, rationing has created increased waiting times.(34)
Although rationing may decrease public spending on health care, there are indirect private costs associated with this practice. These include the discomfort a person feels while awaiting treatment, the economic losses incurred when a person is unable to work for an extended period while awaiting treatment, and the increased travel costs incurred as a result of decreases in the number of service points.(35) When health care is rationed, private costs are unpredictable and it is therefore difficult to determine the overall cost of health care. As a result of rationing, a country’s real health-care spending may be underestimated and this can skew international comparisons.
Moreover, some observers have suggested that rationing is both subjective and economically less effective than other forms of allocation. As there is no way of determining the optimal level of health-care spending in any country,(36) resource allocation – in a context of rationing – is arbitrary. For example, front-line physicians will determine which patients should be treated and, in the absence of clear selection criteria, they may reject patients with fewer chances of suffering ill effects if they are not treated.(37) Similarly, when purchasing new equipment, hospital administrators may be forced to choose a dialysis machine over a magnetic resonance imaging unit (MRI). If the dialysis machine is chosen, patients requiring MRIs will have to travel elsewhere, or be subjected to longer wait times. If the MRI is chosen, those requiring dialysis will suffer. The choice is highly subjective. Rationed allocation is therefore problematic.
WHAT CAN WE EXPECT IN THE FUTURE?
Although controlling health-care costs and maintaining equitable access to services will likely remain important policy goals in most OECD countries, we can expect to see increased emphasis on health-care quality and illness prevention in the future. In a survey of OECD countries in 1996, it was found that “while cost containment remained an issue for most countries, countries’ emphasis on customer satisfaction, equity of health status, and promotion of a healthy lifestyle showed that these issues have become important to member countries as well.”(38) In general, countries have realized that cost containment, on its own, can adversely affect the quality of health care.(39) In addition, countries are beginning to recognize the long-term benefits that are derived from the maintenance of quality health services, the promotion of healthy lifestyles, and the prevention of future illnesses.
For example, many OECD countries have, or are in the process of developing, performance standards and quality assurance programs to ensure the quality of health-care systems. Australia, Canada, France, Mexico, Belgium, Denmark, Austria, Sweden, the United Kingdom and the United States all have such programs. Some countries now link the quality of health services to the reimbursement of costs. This may include financial incentives to increase quality, as in France, or introducing quality as a variable when awarding service contracts, as in Italy.(40) Many countries have implemented strategies to encourage healthier living, as in France and Canada, which have developed educational initiatives to combat substance abuse among teenagers.(41) Other countries are taking steps to prevent illnesses, as in Hungary and Poland, where concerns about the long-term health effects of pollution and poor water quality have prompted efforts to improve the environment. Other countries, such as Canada and the United States, have improved screening programs for breast cancer to promote early detection.(42)
Key future health-care concerns are likely to be focused on: containing costs; maintaining accessibility; and ensuring quality. To address these concerns, private-sector involvement in health-care systems will undoubtedly continue in the future and, as noted, this involvement may increase.
The 1960s and 1970s were a period of health-care socialization in OECD countries, while the 1980s and 1990s were a period of health-care privatization. Increased private-sector involvement in health care has been achieved through cost containment strategies, delivery reforms and new methods of allocation. In general, private financing has increased, while access to some services has decreased.
High public debt, the desire for efficiency, and an aging population have all contributed to the increased reliance on private-sector resources for financing and delivering health care. In the future, we will likely see an increased emphasis on promoting healthy lifestyles, preventing illnesses, and maintaining the quality of health-care systems in OECD countries. Addressing these objectives while maintaining costs in the face of increasing demands will likely require even greater private-sector involvement in health-care systems. As a result, we are likely to see further government withdrawal from the health-care sector in most OECD countries, a trend that is consistent with government withdrawal from other sectors.
(1) This document is an edited and updated version of Public and Private Sector Involvement in Health Care Systems: An International Comparison produced by the Parliamentary Research Branch, Library of Parliament, May 1997.
(2) Gross domestic product is the value of all goods, services and investments in Canada during a defined period of time.
(3) For a detailed discussion of these justifications, see Deber et al., pp. 434-435.
(4) Ibid., p. 434.
(5) Ibid., p. 435.
(6) Ibid., p. 434.
(7) See, for example, Paul Leduc Browne, Unsafe Practices: Restructuring and Privatization in Ontario Health Care, Canadian Centre for Policy Alternatives, 2000; and Pat Armstrong, Hugh Armstrong and Colleen Fuller, Health Care, Limited: The Privatization of Medicare, a report prepared by the Canadian Centre for Policy Alternatives for the Council of Canadians, 2000.
(8) Deber et al., p. 439.
(9) When deductible payment is used, patients pay for the cost of health services up to a specified, fixed level, after which the insurer begins paying. For example, patients will pay for the first $100 of their total prescription costs and then the insurer pays for subsequent prescriptions. When co-insurance is used, patients pay a proportion of the total cost of the service, and the insurer covers any remaining costs. For example, the patient will pay only 10% of the total cost of a service and the insurer pays for the remainder.
(10) In extra-billing arrangements, physicians charge patients an amount in addition to the rate paid by public insurance in order to cover costs. User charges or user fees, which are sometimes called co-payments, require a patient to pay a specified fee upon receipt of the service.
(11) Bill Ross, Jen Nixon, Jamie Snasdell-Taylor and Keir Delaney, International Approaches to Funding Health Care, Volume 2 of Occasional Papers; Health Financing Series, Commonwealth of Australia, 1999, p. 29.
(12) World Health Organization, World Health Report 2000, 2000, p. 99.
(13) Deber et al., p. 441.
(14) Ross et al., p. 73.
(15) Ibid.
(16) Theodore R. Marmor and Kieke G.H. Okma, “Cautionary lessons from the West: What (not) to learn from other countries’ experiences in the financing and delivery of health care” in The State of Social Welfare, 1997, Peter Flora et al., eds., Aldershot, 1998, p. 328.
(17) Ibid., p. 329.
(18) World Health Organization, The World Health Report 1999, p. 34.
(19) OECD, New Directions in Health Care Policy, Health Policy Studies No. 7, OECD, 1995, pp. 41-42.
(20) Susan MacPhee, “Reform the Watchword as OECD Countries Struggle to Contain Health Care Costs,” Canadian Medical Association Journal 164.5, 1996, p. 699.
(21) Deber et al., p. 442.
(22) OECD, New Directions in Health Care Policy, p. 61.
(23) Ulrich K. Hoffmeyer and Thomas R. MacCarthy, eds., Financing Health Care, 2 volumes, 1994, p. 533.
(24) OECD, Ageing in OECD Countries: A Status Report, Volume 5, No. 42 of the OECD Working Papers, OECD, 1997, p. 18.
(25) OECD, Reform of Health Care Systems: A Review of Seventeen OECD Countries, OECD, 1994.
(26) MacPhee, p. 700.
(27) Ibid.
(28) Ibid.
(29) See Karen Davis, “Common Concerns: International Issues in Health Care System Reform,” The Commonwealth Fund, 1998, online at http://www.cmwf.org/annreprt/1998/kdmes98.asp; and WHO, World Health Report 1998, p. 39.
(30) WHO, World Health Report 2000, p. 59.
(31) OECD, New Directions in Health Care Policy, p. 42.
(32) Ibid., p. 44.
(33) Cynthia Ramsay and Michael Walker, Waiting Your Turn: Hospital Waiting Lists in Canada, 6th ed., Fraser Forum, 1996, p. 12.
(34) Ibid., p. 44.
(35) Henke, “Cost Containment in Health Care: Justification and Consequence,” Health Economics Worldwide, 1992, p. 247.
(36) See William Baumol, “Health Care, Education, and the Cost Disease: A Looming Crisis for Public Choice,” Public Choice, Vol. 77, 1993, pp. 17-28; and Henry Aaron, “Thinking About Health Care Finance: Some Propositions,” Health Care Reform: The Will to Change, OECD, 1996, pp. 47-57.
(37) Ramsay and Walker, p. 9.
(38) OECD, Social and Health Policies in OECD Countries: A Survey of Current Programmes and Recent Developments, OECD, 1998, p. 85.
(39) Ross et al., p. 26.
(40) Ibid., p. 94.
(41) Ibid., p. 88.
(42) Ibid., pp. 87-88.