BP-463E
EMPLOYMENT INSURANCE
REFORM:
Prepared by: TABLE OF CONTENTS
EMPLOYMENT INSURANCE REFORM: The Employment Insurance Act requires Parliament to report annually until the year 2001 on the impact of the reform it has brought to Canada’s unemployment insurance system. On 12 February 1998, the government tabled the first annual assessment report on Employment Insurance (EI). Although data limitations permitted only a preliminary analysis, the available information suggests that the reform has helped reduce program costs, strengthened work incentives, and extended adjustment assistance to more individuals, despite reduced expenditures on employment benefits and support measures. The implications of the growing surplus in the EI Account were not addressed in the first report. The Employment Insurance Act - the most extensive reform to Canada’s unemployment insurance system in more than two decades - was implemented in two phases, one beginning in July 1996 and the other in January 1997. While EI retained many of the features of its predecessor, Unemployment Insurance (UI), there were several significant changes. While the minimum qualification requirement continues to be inversely related to regional unemployment rates, the first hour of work is now insurable and minimum qualification requirements are based on hours instead of weeks of insurable employment. These requirements can increase by as much as 100% for individuals who commit one or more violations under the Act. The minimum qualification requirement for regular benefits for new entrants and re-entrants was raised from an hourly equivalent of 700 hours to 910 hours. One of the most significant measures to strengthen work incentives is the method of calculating the average weekly earnings on which the benefit rate is applied. Under this reform, weekly insurable earnings are averaged over the larger of two divisors: the number of weeks in the rate calculation period in which a claimant has insurable earnings or the minimum divisor contained in section 14(2) of the Act.(2) Stronger work attachments are also promoted under a somewhat modified version of experience rating, called the "intensity rule." Under this provision, a claimant’s benefit rate varies from 55% to 50%, falling as the number of weeks of benefits received within a five-year period rises. The reform also reduced the maximum duration of benefits from 50 to 45 weeks. In terms of income redistribution, low-income claimants with children are entitled to a family income supplement. Low-income claimants are also permitted to earn up to $50 per week or 25% of EI benefits, whichever is higher, before their weekly benefits are reduced. High-income earners, on the other hand, face more stringent benefit repayment provisions and enjoy no growth in weekly benefits as maximum annual insurable earnings are frozen at $39,000 (down from $43,940) to the year 2000. Under the new process for setting premium rates, the EI Account may generate an unspecified cumulative surplus to ensure that enough revenue exists to meet EI costs and maintain stable premiums over a business cycle. In addition to enhancing the "active" elements of support for eligible unemployed individuals, the EI reform seeks to harmonize federal-provincial-territorial spending on labour adjustment measures and reduce program overlap and administrative duplication. Of the 11 agreements signed thus far (Ontario does not have an agreement), more than one-half give a province/territory the responsibility of designing and delivering EI employment benefits and support measures. With the number of new claims declining, the introduction of the minimum divisor, and the reduction in maximum weekly benefits, it is not surprising that EI expenditures declined significantly during the first 12 months of the reform. Between July 1995 to June 1996 and July 1996 to June 1997, expenditures on all benefits declined from roughly $13 billion to $11.5 billion (11.5%);(3) expenditures on regular benefits (excluding those paid under Part II (active measures) of the Act) declined by 8.4%, and spending on active EI measures declined by 30%.(4)
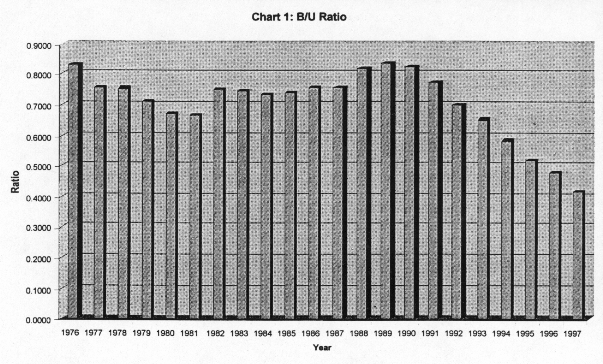
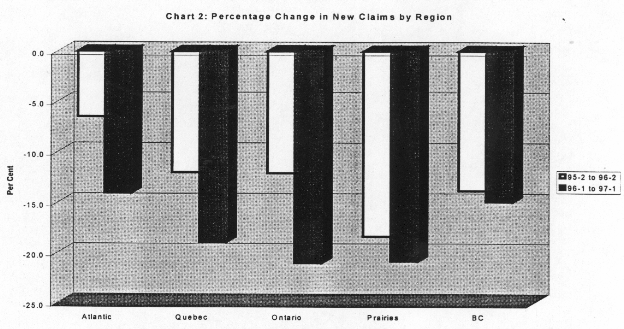
The new qualification provisions were introduced in two stages - starting July 1996 and January 1997. The number of new claims in the latter half of 1996 were 149,000 less than in the latter half of 1995, and claims fell even more, by 169,000, between the first halves of 1996 and 1997. Relative to the number of unemployed, the number of new claims following the reform declined from 0.87 to 0.72 between the second halves of 1995 and 1996, and from 0.63 to 0.51 between the first halves of 1996 and 1997. A similar trend, as exhibited in Chart 1, is found in terms of the ratio of the number of regular beneficiaries (B) to the number of unemployed (U). The recent steady decline in this ratio is currently the subject of a study by Human Resources Development Canada. Several factors are undoubtedly responsible for this trend. For instance, the data underlying the covered populations in the numerator and the denominator have become less compatible due, for example, to growth in non-standard employment (especially self-employment), unemployment persistence, and the numerous changes that have been made to tighten EI/UI eligibility since the beginning of this decade. Roughly one-half of the decline in new claims between the second halves of 1995 and 1996, and one-third of the decline between the first halves of 1996 and 1997 are attributable to the fact that there were fewer claimants with 20 to 25 weeks of insurable employment. This is the claimant category most affected by the higher qualification requirement for new entrants and re-entrants. There is also evidence that some new entrants and re-entrants have been able to satisfy the new qualification requirement, however; the number of new claims among those with 26 to 30 weeks of insurable employment increased by 7.5% between the second halves of 1995 and 1996 and by 3.5% between the first halves of 1996 and 1997. This is the only claimant category to register an increase in new claims during these periods.(5) As illustrated in Chart 2, the largest relative regional decline in the number of new claims was in the Prairies between the latter halves of 1995 and 1996 and, in Ontario and the Prairies, between the first halves of 1996 and 1997. This reflects, in part, the relative improvement in labour market conditions in both the Prairies and Ontario throughout this period; unemployment in the Prairies declined by approximately 9% between the latter halves of 1995 and 1996 and by approximately 12% between the first halves of 1996 and 1997, while Ontario witnessed a decline of 1% between the first half of 1996 and the first half of 1997. Average weekly benefits to which new claimants are entitled declined in all regions between the latter halves of 1995 and 1996; nationally, average weekly benefits declined from $282 to $275 during this period. Between the first halves of 1996 and 1997, these payments remained unchanged at $277 for the country as a whole; however, claimants in Atlantic Canada and Quebec witnessed a slight decline, while those in the Prairies experienced a slight increase.(6) EI’s family income supplement is providing the expected higher top-up to eligible claimants; weekly payments are roughly double those paid prior to the reform.
Surprisingly, the introduction of the minimum divisor for calculating average weekly earnings does not appear to have had much of an impact, at least to date. In fact, between the second halves of 1995 and 1996, the percentage of claims with two weeks above the minimum qualification requirement increased nationally by 50%. This evidence of a stronger attachment to work waned, however, between the first halves of 1996 and 1997 in every region except the Prairies.
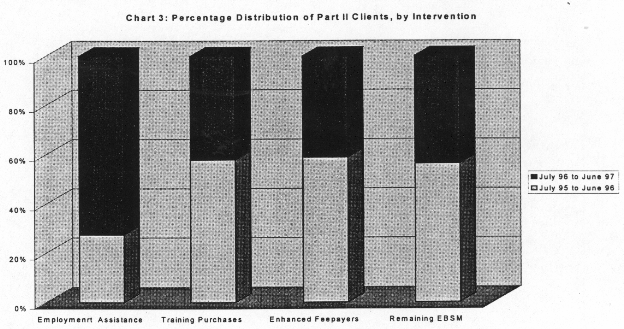
As previously noted, one of the key objectives of the EI reform is to enhance the active elements of Canada’s income support system for the unemployed. Clearly, this was not achieved, at least in the first 12 months of the reform, when expenditures on EI employment benefits and support measures (EBSM) declined by 30%.(7) Regionally, Part II expenditures declined during this period: in Atlantic Canada, 33.7%; Quebec, 45.7%; Ontario, 19.5%; the Prairies, 28.9%; and British Columbia, 11.7%. Despite these reduced expenditures, 32% more unemployed individuals were served under Part II of the Act during the first 12 months of the reform than in 12 months prior to the reform. As illustrated in Chart 3, the distribution of clients receiving employment benefits and support measures changed significantly between the period from July 1995 to June 1996 and the period from July 1996 to June 1997. Although not evident from the data depicted in Chart 3, virtually all of the increase in clients served during this period is attributed to the shift toward short-term intervention assistance. The apparent shift away from interventions designed to address the problem of structural unemployment, if durable, could undermine the effectiveness of EI adjustment assistance. The goal for Part II clients is to achieve a 35%-65% split between prior and current claimants. This breakdown is not yet known. While the data pertaining to the pre- and post-reform distribution of clients from designated target groups are incomplete, preliminary results suggest little change here, save a potential two percentage point decline in the percentage of Aboriginal clients. Unfortunately, data limitations precluded a more complete assessment of the impact of the first year of the EI reform. The reform’s budgetary aim of reducing costs by 10% appears to have been met. Preliminary data also suggest that the reform has strengthened work incentives: there was an increase in the number of claims with hours of insurable employment above the minimum qualification requirement and a less than expected reduction in weekly benefits. While it appears to have been too early to assess adequately EI’s impact on individuals, communities and the economy, as required under section 3 of the Act, a more comprehensive assessment can be expected in the next report. By then, we will have more EI administrative and survey data; the results of a comprehensive analysis of the decline in the B/U ratio; a preliminary evaluation of labour market development agreements; and the results of several evaluation studies currently underway to identify, for example, the impact of EI on job displacement, job separation behaviour, and the distribution of hours of work. (1) For an extensive treatment of the overall reform package, see M. Hurley and K. Kerr, Bill C-12: An Act Respecting Employment Insurance in Canada, LS-237E, Library of Parliament, 8 March 1996. (2) It was quickly recognized that this approach imparted a disincentive to work beyond the number of minimum divisor weeks. A number of projects are now underway to determine the best way of rectifying this problem. (3) Another contributor to the decline in program costs during this period was the decline in the flow of individuals from employment to unemployment. (4) While the EI reform called for a reallocation of some 40% of savings to employment benefits and support measures, actual expenditures under Part II declined from $1.7 billion for the period July 1995 to June 1996 to $1.2 billion in the period July 1996 to June 1997. According to the 1997 EI Monitoring and Assessment Report, a key reason for the unanticipated decline in Part II spending was the transitional period for implementing the new measures. Apparently, spending is back on target and overall spending on Part II measures in 1997-98 is expected to exceed that in 1996-97. (5) This preliminary result is contrary to that in the impact analysis released by Human Resources Development Canada while the EI legislation was in Committee. According to this analysis, approximately 90,000 workers would become eligible for benefits as a result of the elimination of minimum insurability criteria and the implementation of the hours-based qualification requirement. An equal number of workers were expected to become ineligible due to the hours-based entrance requirement and the higher qualification requirement for new entrants and re-entrants. Thus, while these changes were expected to have an impact on the distribution of claimants, the overall impact on the size of the claimant population was expected to be negligible. (6) In terms of special benefits, the average weekly payment declined from $290 to $267 between the second halves of 1995 and 1996, and from $286 to $281 between the first halves of 1996 and 1997. It is somewhat surprising that the magnitude of this decline is more pronounced than that for regular benefits, since the intensity rule does not apply to special benefits and the effect of the minimum divisor is negligible. (7) This underspending was attributed to a period of transition. These expenditures are reportedly back on track, forecasted to be roughly $1.75 billion in 1997-98 and estimated to be $1.95 billion in 1998-99. |


