90-3E
FEDERAL REVENUES:
CHANGING TRENDS
AND THE QUEST FOR TAX REFORM
Prepared by:
Jean Soucy, Economics Division
Marion G. Wrobel, Senior Analyst
Revised 27 March 2000
TABLE
OF CONTENTS
A. Changing Trends in Revenues by Source
B. Federal Policy and Revenue Sources
3. Administration and Compliance Costs
4. The Case of the Corporate Income Tax
D. Federal Budgets and the December 1992 Economic Statement
J. The Debate about EI Premiums
FEDERAL REVENUES:
CHANGING TRENDS
AND THE QUEST FOR TAX REFORM*
In 1970, federal revenues amounted to just over $15,000 million, which represented less than 17.2% of Gross Domestic Product (GDP). Today the dollar amount of federal revenues is much higher, about $162,000 million; however, as a percentage of GDP, these revenues are approximately 16.9% in 2000-2001. Yet in nearly three decades much has happened to the amount of revenue that the federal government collects, the way in which it is collected and our understanding of the economic consequences.
This review examines the trends in federal revenues since the Carter Commission Report of 1967. It discusses the quest for higher revenues in the early 1970s and the reform measures of that decade which later substantially reduced government revenues, and goes on to the Conservative government’s deficit reduction measures, which increased the level of taxes, and efforts at tax reform. The role that revenue growth played in eliminating the federal deficit is also considered. This review also considers several analytical issues related to taxation.
A. Changing Trends in Revenues by Source
Figure 1 portrays the pattern of federal revenues, expressed as a percentage of GDP, since fiscal year 1970-71. It is based upon the Public Accounts presentation of federal government transactions and data presented in the 2000 budget.
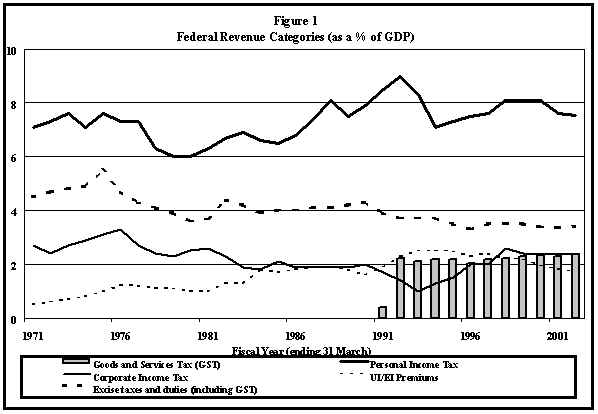
The largest source of federal revenues is the personal income tax (PIT). In fiscal year 1992, it exceeded 9% of GDP. It is now steady at about 7.5%. At one point in 1979, personal income taxes accounted for only 6% of GDP. Indeed, one can argue that the latter half of the 1970s was a period of personal income tax reform which was eroded through the 1980s. Stage I reform of the Progressive Conservative government, on the other hand, had only a slight and shortlived impact on the increasing use of personal income taxes as a source of federal revenues. At almost 50% of federal revenues, the personal income tax is more important as a source of federal revenue today than it has been in the last two decades. Figure 1 understates the importance of PIT revenues by close to 10%. The Canada Child Tax Benefit, although essentially a spending program, is delivered via the tax system and its cost is subtracted from PIT revenues.
The second largest source of federal revenues has traditionally been sales and excise taxes. These taxes have varied enormously over time. In the early 1970s they amounted to close to 5% of GDP and provided almost 30% of federal revenues. By 1983, they were providing about 17% of federal revenues and amounted to 4% of GDP. They increased in importance slightly through the 1980s, when federal budgets made significant use of them as a source of revenue. The introduction of the Goods and Services Tax (GST) was expected to maintain this trend, although receipts in the early years were less than expected.
Since 1983, corporate income taxes (CIT) have been fairly constant at about 2% of GDP and 12% of revenues. Through the 1970s these taxes accounted for about 15% of federal revenues. The recent recession, however, has had a very dramatic impact on corporate income tax revenues. By 1994 such revenues had fallen to 1.3% of GDP, accounting for only 8.1% of total revenues. The recovery of corporate profits has led to increases in tax revenues to more normal levels.
Employment Insurance (EI, previously UI) premiums increased substantially, and constituted the second most important source of federal revenues in the early 1990s. In 1971, these premiums were less than half as important as they were to become. The CIT and the GST have overtaken EI premiums in importance. They now account for more than 11.2% of revenues and stand at about 1.8% of GDP.
B. Federal Policy and Revenue Sources
Any analysis of Canadian taxation cannot ignore the work of the Carter Commission (The Royal Commission on Taxation), which issued its report in 1967. That report was guided by several important and, at that time novel, precepts. These included the belief that fairness required the use of a comprehensive income base, including virtually all additions to wealth; that vertical equity (i.e., the notion that those with greater ability to pay should be subject to higher taxes) is best achieved via a progressive income tax with a maximum rate of 50%; that horizontal equity (i.e., the notion that those in similar economic circumstances should pay the same amount of tax) should be an important part of the tax system; and that taxes are paid by people, not corporations. This last precept called for a full integration of the corporate and personal income tax systems so as to avoid double taxation of corporate profits.
Additionally, the Commission favoured the use of the family, rather than the individual, as the taxpaying unit, since the former measured economic well-being better than the latter. In recognition that annual income is not a perfect interval for assessing taxes, five-year averaging was recommended. The Commission also favoured income taxes over other types of taxation, yet recognized that income tax rates would have to be far too high if they were to meet the needs of the government to raise revenue. This point is interesting, coming as it did at a time when government spending and taxation were far lower than today.
The Carter Commission was not silent on the manufacturers’ sales tax; indeed it viewed that tax as a problem area. The suggested alternative closely resembled the options that the Progressive Conservative government considered for Stage II of tax reform, i.e. some variant of a Value-Added Tax (VAT) or a national sales tax. In fact, however, the Commission considered the most efficient form of tax to be a retail sales tax, preferably to be administered by the provinces.
It is clear that the federal and provincial tax systems have generally gone against many of the Carter Commission conclusions.
The Carter Commission report met with only mixed success as a consequence of the vehement opposition that some of its recommendations attracted. In the end, one-half of capital gains were made subject to tax, rather than the full taxation that had been recommended. There was also movement toward integrating the personal and corporate income taxes, with the implementation of a dividend gross-up and credit system. The top federal rate declined to 47%, implying an average total top tax rate of about 60%, down from the previous high of 80%. A new general tax-averaging provision was also introduced to offset some of the higher taxes that variable income produces in a world of progressive income taxation.
The major change to come out of the 1970s was the indexation of the personal income tax system, whereby the tax brackets and major exemptions were fully indexed to the rate of inflation, albeit with a lag. Inflation, especially a high rate of inflation, automatically increases the real income tax burden of taxpayers by pushing them into higher tax brackets even though their real incomes remain unchanged. The impact of this phenomenon, known as "bracket creep," is most pronounced on lower income individuals, because it is at these lower income levels that marginal taxes on income increase fastest.
A fully-indexed personal income tax system would take in a constant proportion of GDP (as a proxy for the personal income base) in the event of no real income growth per capita. But personal income taxes as a percentage of GDP declined substantially from 1975 to 1980. Other changes which accounted for this decline in tax revenues included the $1,000 exemptions for investment income and pension income, the introduction of the Registered Home Ownership Savings Program (RHOSP) and the increase in the level of allowable contributions to Registered Retirement Savings Plans (RRSPs). During this period, the government also introduced and expanded the use of a tax reduction credit, which had the effect of removing lower income taxfilers from tax liabilities.
In June 1986, the Minister of Finance, the Hon. Michael H. Wilson, released his White Paper on Tax Reform. The reform process was to comprise two distinct stages: the first to deal with income tax reform and the second to deal with sales tax reform.
Income tax reform on the personal side did two things. It reduced the number of tax brackets from ten to three, and it converted a number of exemptions and deductions into non-refundable tax credits. It also lowered the top marginal tax bracket. On the corporate side, tax reform lowered marginal tax rates in general but it also removed a number of tax preferences so that the base was broadened; in fact, the proportion of corporate income subject to tax increased from 72.4% on average to 84.1 %. This represents a 16% increase in the base.
This early stage of tax reform was to shift emphasis away from the personal income tax towards the corporate income tax and the sales tax. According to the White Paper on Tax Reform, personal income tax revenues were to decline by $10,300 million over four years, 1988-89 to 1991-92 inclusive. Over the same period, corporate income tax revenues were to increase by $3,845 million and sales tax revenues were to increase by $4,785 million. The sales tax increases were to be maintained once the Goods and Services Tax was implemented.
The introduction of the Goods and Services Tax (GST) was initially seen as a move even further away from the use of the PIT as a revenue tool. Stage I of reform established three federal income tax rates: 17%, 26%, and 29%. As part of the Stage II reforms, the middle rate was to have been reduced by one percentage point, as suggested in the August 1989 technical paper on the GST and by as much as three percentage points as hinted at earlier. This idea was later abandoned. In the 2000 federal budget, the middle rate was finally reduced by two percentage points, effective 1 July 2000. This rate is to be further reduced to 23% over the next five years. Starting in 1985, federal budgets had introduced and increased personal income tax surtaxes independently of the tax reform process. These surtaxes were to have been eliminated with Stage II reform, but their elimination began only with the 1998 federal budget. Not until the 1999 federal budget did we see the 3% surtax completely eliminated and the 5% high income surtax is still in place, though it is to be eliminated over five years. With the 2000 federal budget, the income threshold for the 5% surtax was increased from $65,000 to about $85,000.
The GST represents Stage II of reform. The government originally envisaged a 9% tax rate, but subsequently chose a 7% rate, in response to recommendations made by the House of Commons Standing Committee on Finance. The Canadian variant is not nearly as complicated as some European variants of the Value-Added Tax (VAT), but the federal government did not choose to follow the simpler New Zealand route with its broad base, limited exemptions and zero-rated products.
One tax change of the 1980s which is not usually viewed as a reform, was the decision to limit indexation of tax brackets and credits to the rate of inflation, less three percentage points. This loss of full indexation, ostensibly a deficit reduction measure, goes against the very grain of the developments of the 1970s by reintroducing an element of non-neutrality into the workings of the personal income tax system.
Tax reform by the Progressive Conservative government of Prime Minister Brian Mulroney cannot be viewed independently of the desire to control and reduce the deficit, a problem which plagued that government since it first came to power in 1984. The abandonment of full indexation, the introduction of a variety of surtaxes and the increased sales and excise tax rates are all examples of this policy. Indeed, the GST was dubbed a new money machine by some commentators, and was viewed by the government as a necessary tool for deficit reduction. It proved to be neither.
The full indexation of the tax system was restored in the 2000 federal budget, retroactive to 1 January of this year.
Everyone thinks the tax system should be fair and equitable, yet the public has no generally accepted and well articulated definition of fairness to draw upon. It is easy to say that two individuals in similar economic circumstances should pay the same tax; it is far harder to determine when economic circumstances are the same if sources of income, age, family structure, etc. differ. It is easy to say that rich individuals should pay more tax than poor individuals; it is far harder to say how much more they should pay.
The concept of horizontal equity requires that similarly situated individuals pay the same tax, whereas the concept of vertical equity requires that the tax burden be linked to ability to pay. The latter concept receives far more prominence in policy debates than the former. Much of the tax incidence literature (studies purporting to show how the burden of taxation is linked to income) is concerned with vertical equity.
If we believe that a tax system should be "fair," over what time period do we judge its fairness? If we recognize that a day or a week or a month are inappropriate time periods, do not the same problems plague the annual estimation of tax equity? These questions are important because recent research indicates that the lifetime incidence of taxes differs substantially from its annual counterpart. Taxes viewed as regressive when considered on an annual basis may be proportionate or even progressive when viewed over an individual’s lifetime.
The perception that there is a need for a minimum tax takes on a different dimension if the yearly test for equity is abandoned. Annual snapshots of the tax and income relationship indicate that some taxpayers have been able to use tax preferences to pay little or no tax in certain years, even though their apparent gross incomes are relatively high. Yet on a lifetime basis it will usually be apparent that such an advantage was temporary, with long-term taxes bearing the appropriate relationship to income. On a lifetime basis, no need for a minimum tax exists.
Revenue Canada has attempted to analyze the extent to which rich Canadians can consistently avoid paying tax; unfortunately the data are not current. Nevertheless they do demonstrate the temporary nature of this phenomenon. For example, between 1977 and 1981 inclusively, there were 896 instances of individuals with more than $200,000 of income (expressed in 1981 dollars) who paid no income tax. However, 84% of all such taxpayers avoided tax for only one year out of this five-year period; 12% avoided paying tax for two years, and no one was able to avoid paying any income tax for all five years.
The more important reason for abandoning annual accounting is the fact that lifetime calculations might give a better indication of the desirability of certain types of taxation. The relative income position of taxpayers changes over their lifetime. They start their working lives with relatively low incomes, little wealth and high rates of consumption. As they age, their incomes increase and their savings patterns change, and in the process they accumulate wealth. By the time they retire, their incomes are again relatively low and consumption is high, but now the accumulated wealth can be drawn upon for that purpose.
An annual snapshot of income distribution picks up two types of individuals, those for whom annual income is a good indicator of their lifetime income and those for whom it is not. There are, of course, rich individuals who will always be relatively rich and poor individuals who will always be relatively poor. But for many, the annual snapshot reveals only the temporary position in which individuals find themselves.
Lifetime tax incidence differs from annual tax incidence because it is less affected by temporary income fluctuations. The measure of fairness is whether those with low lifetime incomes pay less tax than those with high lifetime incomes (vertical equity) and whether individuals with the same lifetime income pay the same tax (horizontal equity).
A Canadian study of tax incidence on a lifetime basis indicates several areas in which our views of taxation need to be reconsidered. The apparent progressivity of taxes can change dramatically. Taxes usually thought of as progressive, such as the corporate and personal income taxes, continue to be progressive on a lifetime basis, but to a lesser extent than an annual view would suggest. Sales and excise taxes, which are normally viewed as highly regressive, turn out to be only moderately so and might even be considered proportional.
This view of tax incidence based on lifetime income might also be more reliable. Tax incidence studies are notorious for the extent to which the results can vary dramatically as the basic assumptions change. Using lifetime income makes the results more robust in the sense that changing initial assumptions have less effect on final results.
What is the effect on the economy of $1 of additional tax revenue? The private sector obviously has $1 less to spend and the public sector $1 more, and macroeconomic discussions of tax policy rarely go beyond such simple arithmetic. Yet we know that the effects on the economy are far more pervasive.
In general, one dollar of tax revenue received costs the private sector more than one dollar because of a misallocation of resources in the economy. This is the concept of the welfare cost of taxation, whereby resource use is altered in such a way as to reduce the well-being of individuals and families. The higher the tax, the larger is this burden and it is conceivable that the welfare cost of taxation could far outweigh the revenues government received from a particular tax.
For example, the government might view a fountain pen excise tax as a particularly desirable tax. The chosen tax rate might be so high, however, that the sale of fountain pens in Canada fell to zero. No revenue would be received, yet clearly a welfare cost would be imposed. The price Canadians are willing to pay for fountain pens would normally make it profitable for someone to supply those pens. Consumers would see this as an efficient use of their income and producers would see this as an efficient use of their resources, but government intervention in the market via the excise tax might eliminate this opportunity for mutual benefit.
There is much public debate about who bears the burden of taxation, that is, the incidence of the direct revenue cost. This issue is dealt with elsewhere in this paper. There is very little debate, however, about these welfare costs of taxation and it is not at all clear that the distribution of these costs would be the same as the distribution of the direct costs. The fountain pen example used above is clearly extreme, but it does indicate an important aspect of taxation which incidence studies cannot tackle. Our conclusions about the apparent fairness of certain taxes might be incorrect.
There exists a welfare cost for all taxes because they all distort relative prices and consequently affect economic behaviour. Given the current tax system, the marginal welfare cost of additional taxes is very high; every time the government tries to raise an additional dollar, about forty to fifty cents disappear from the economy via a variety of disincentive effects. In high-tax jurisdictions such as Sweden, the marginal welfare cost is estimated to be many times the tax revenue collected.
After World War II, the federal government imposed very high marginal tax rates on the wealthiest of citizens, almost 100%. This has changed as the "disutility" of such confiscatory rates has become apparent; they raise small amounts of revenue yet have a high welfare cost.
Since the early 1970s, the federal government has continued this tendency of decreasing its highest marginal tax rate, from 46% in 1970 to 29% today. What high income earners have gained from the federal government, however, they have lost, to some extent, to provincial governments.
These marginal tax rates exclude the variety of surtaxes that had been imposed by the federal government and several provincial governments on taxes otherwise payable (not on income.)
High marginal tax rates for the rich are often favoured because they suggest that the tax system is progressive. But, as has been argued here, high tax rates have a high associated welfare cost. The negative consequences of behaviour induced by high taxes can outweigh the beneficial, distributional consequences of a very progressive tax system.
3. Administration and Compliance Costs
Every time the government imposes a $1 tax on the economy, the private sector incurs costs well in excess of the amount of tax revenue transferred to the government. The previous section on efficiency dealt with an intangible and difficult-to-measure source of costs to the economy. This section deals with more obvious costs, those imposed on governments who collect taxes and those imposed on taxpayers who comply with these tax laws.
The costs of administering federal tax laws comprise the cost of running the Department of National Revenue, related costs incurred by the Offices of the Auditor General and the Comptroller General and any costs incurred by other levels of government who might collect federal taxes; for example, the government of Quebec is now collecting the federal GST in that province.
Taxpayers also incur costs. Employers must calculate and withhold the Personal Income Tax and a variety of payroll taxes on behalf of their employees. Employers must also determine the appropriate amount of tax payable on their own account. Financial institutions must print and distribute to clients information slips on their taxable income and tax preferences according to the Income Tax Act. Finally, individual taxpayers must prepare PIT returns, or hire someone to do this for them.
A study prepared for the Canadian Tax Foundation concluded that the cost in 1986 of administering and complying with the federal personal income tax, Canada/Quebec Pension Plan payments and Unemployment Insurance premiums totalled $5,500 million. Only 13% of this total was borne by the federal government, while 36% was borne by individuals and 51% by employers.
Another study, conducted in 1993 for the Department of Finance, examined 200 small businesses across the country to determine the size of their GST compliance costs. The study indicated that these costs are substantial. For firms with sales in excess of $1 million annually, they average 2.65 cents for every $1 of GST remitted. For firms with sales under $100,000 annually, the cost is 17 cents for every dollar remitted. According to the authors, there was virtually no representation by firms with sales under $50,000 per year, the firms that would likely face exceptionally high costs.
The majority of participants expressed a desire for harmonization of the federal and provincial sales. Ironically, the strongest support came from businesses in Quebec, even though that province has come closest to harmonizing its tax with the GST.
4. The Case of the Corporate Income Tax
It is often claimed that the corporate sector does not pay its "fair" share of taxes. The effective rate varies substantially over time, peaking during a recession, when profits plummet. This is not particularly desirable in a tax base; the tax take is unpredictable and the effective tax rate is highest when the taxpayer is least able to pay.
About 75% of changes in the revenue share of the CIT can be accounted for by changes in the importance of corporate profits. Part of this change is cyclical, while another part is due to a longer term trend to reduced profits because of a greater reliance by corporations upon debt financing.
But when the question of corporate taxation arises, we often forget about the ultimate incidence of the tax. This matter is well put in the following quotation:
Taxes are paid by people. They are not paid by corporations, partnerships, gifts, bequests, estates, trusts, sales, transfers, investments, savings, property, consumer expenditures, or any of the long list of things we usually list as subjects of taxation. Taxes imposed on these subjects are only a means of taxing people. (J. Harvey Perry, A Fiscal History of Canada - The Postwar Years, Canadian Tax Paper No. 85, Canadian Tax Foundation, Toronto, 1989, p. 286)
The matter of corporate tax incidence is not completely settled. But in calling for greater or lesser amounts of corporate taxation, policymakers must answer two questions: 1) whom do they wish to tax? and 2) where, in their opinion, does the incidence of the CIT lie?
As noted above, the federal government abandoned full indexation of the personal income tax system as of 1985, before restoring it in 2000. Because inflation was generally below 3% per year in the 1990s, however, the system could be thought of as effectively de-indexed in those years.
This has had a very profound effect on governments and families. By 1995, the federal balance was about $6,400 million more than it would have been had full indexation been in place over the past ten years. Taxes were $5,700 million higher, while spending was $700 million lower. De-indexation also applies to provincial taxes; as a result, the disposable income of Canadians in 1995 was $9,500 million lower than it would have been with full indexation.
The OECD has also commented upon the negative effects of de-indexation. It estimates that the basic federal tax rate increased by 13% between 1988 and 1998, from 10.8% to 12.2%. The effect of this increase was proportionately greater for lower- and middle-income taxpayers. It trebled the average tax rate of those with incomes below $10,000. The average tax rate went up by one-third for those with incomes between $10,000 and $25,000, while it increased by only 2% for those with incomes in excess of $150,000.
Furthermore, the OECD has concluded that, over ten years, partial indexation pushed 1.4 million low-income individuals on to the tax rolls. An even larger number, 1.9 million individuals, were pushed from the lowest to the middle tax bracket, while 600,000 were pushed from the middle bracket to the top bracket.
This lack of full indexation has contributed to the fact that Canada relies more on personal income tax than do other G-7 nations. It has also hurt Canada’s competitive position with respect to the United States, a position that has worsened over the past two decades. Moreover, while the tax burden is well known to be greater for Canadians than Americans at upper income levels, this is also the case for those with more modest incomes. The marginal tax rate of Canadians earning the average production wage is 50% higher than it is for their American counterparts.
In its 1998 Economics Surveys, the OECD suggests that improvements should be made to the sales tax. There are only four provinces – Nova Scotia, New Brunswick, Newfoundland and Quebec – where sales taxes have been harmonised. Elsewhere, distortions to business inputs and traded products exist as a result of non-harmonisation; however, provincial governments are apparently unwilling to intervene to change this situation. This is unfortunate, considering that sales tax harmonisation could improve Canadian competitiveness. This same lack of co-operation between the federal and provincial levels of government also hampers reform in other tax fields.
D. Federal Budgets and the December 1992 Economic Statement
The 1991 federal budget proposed little in the way of new taxes, with the following two exceptions, a significant hike in tobacco taxes, expected to raise almost $1,000 million the following year, and a $2,000 million increase in UI premiums.
The recession was expected to have little impact on federal revenues but a much greater impact on federal expenditures. In 1991-92, total revenues were forecast to fall by less than 1% on account of the recession. While corporate income tax revenues were expected to be 20% below the previous year’s forecast, increased personal income tax revenues were expected to offset most of this decline. When policy initiatives on the revenue side are taken into account, total revenues in 1991-92 were expected to be $2,500 million higher than was originally forecast in the 1990 budget.
The picture painted in the 1991 budget was completely revised in the 1992 budget. The poor performance of the economy was cited as the cause of a $5,700-million shortfall in revenues for 1992, growing to a $7,500-million shortfall in 1993. The largest absolute decrease is expected in the personal income tax, but the largest proportional decline will be in the corporate income tax.
Even this bleak picture proved to be excessively optimistic. For 1992-93, the Minister of Finance saw revenues as $8,000 million below the estimates presented in the 1992 budget - more than $15,000 million below the figure originally cited in the 1991 budget. In 1993-94, revenues were expected to be $10,000 million less than the projections in the 1992
The economic statement proposed no tax increases. Instead, it contained a variety of measures that would cost the government about $1,000 million in reduced revenues over a three-year period. Such measures included a one-year extension for the use of RRSPs for first-time home buyers, a moratorium on UI premiums for new small businesses and a cap on UI premiums for small business that increased employment. Small business firms were also granted a 10% investment tax credit.
The 1993 budget contained no new taxes and no new tax increases. It did include several tax measures which were expected to reduce federal revenues by $400 million over the next five years. These included an elimination of the annual limit on the use of the investment tax credit, new capital cost allowance rules for patents, an extension of the Scientific Research and Experimental Development Program to allow firms with taxable income in excess of $200,000 to earn refundable credits, and an amendment to regulations which would allow corporations enhanced write-offs of rapidly depreciating equipment such as computers.
But the real message of that budget pertained to the continuing decline in federal revenues as a consequence of the economy’s weak performance. Revenues in 1992-93 were estimated to be $1,200 million less than predicted in the December 1992 Economic Statement and, consequently, $9,200 million less than predicted in the 1992 budget. Revenues for 1993-94 were also expected to fall short of the prediction made in the December Economic Statement.
Figure 1 shows the impact of the recession on corporate and personal income tax revenues. Corporate taxes fell dramatically through the recession and will recover only slowly through the rest of the decade. The same is true of personal income taxes, although the decline has been more moderate. Part of this decline is, however, illusory as the Child Tax Credit is treated as a tax expenditure assessed against the personal income tax even though it largely replaced the Family Allowance, which was treated as a program expenditure and accounted for over $2,000 million in spending.
The other significant trend in Figure 1 shows that UI premiums have overtaken the corporate income tax as a source of revenue. In 1993, UI premiums at about 2.5% of GDP were almost five times as high as they were in the first half of the 1970s.
The striking element in this budget was the recognition that federal revenues had been declining significantly over the past few years. In 1991-92, federal revenues equalled 18.1% of GDP. In 1993-94, they were equal to only 16.1% of GDP, a very significant drop. With the exception of the reduction in the surtax announced in the 1992 budget, there were no significant tax policy changes to account for this drop.
One recent policy change affecting revenues was the amalgamation of the family allowance, refundable child tax credit and non-refundable dependent credit into a new child tax benefit. This reform changed some program spending into tax expenditure and hence resulted in a trend to lowered revenue. The reformed system cost the federal government more than was originally anticipated. At the time the system was proposed, costs were estimated at $4,900 million per year, up from the $4,500 million of the old system. The child tax benefit was, however, expected to cost $5,500 million in 1993-94, an amount to decline only slightly over the next two years. Since the program’s benefits are determined by family income, the overall cost is sensitive to the state of the economy; thus, part of this increase could be attributed to the recession and slow recovery. The transition costs were also high, however. Because of the timing of benefit payments under the various child-related programs, the two systems overlapped in calendar year 1993. This overlap reduced revenues by $2,500 million over two fiscal years.
Other one-time and extraordinary events conspired to reduce revenues in 1993-94. Nevertheless, the relationship between the status quo level of revenues and GDP weakened substantially in that year. The budget pointed to specific economic circumstances that contributed to this decline, such as slow growth in personal incomes coupled with a relatively high indexation factor for the PIT. It was predicted that this relationship would strengthen to its pre-recessionary levels only after a couple of years.
In 1993, federal revenues were $121,452 million, only 7% higher than in 1990. While personal income tax receipts over that three-year period were up by 12%, to $58,300 million, corporate income taxes were down by 36% and total sales and excise tax revenues were down by almost 7%. The only other area of strong revenue growth, which in this case indicated poor economic performance, was that of premium revenues from unemployment insurance, which grew by 63%.
In 1994, revenues dropped precipitously to $116,000 million on account of the state of the economy, some one-time events and, most importantly, the introduction of the child tax benefit, which had the effect of converting some spending programs into tax expenditures and thus lowering revenues. The transitional costs associated with the move to the child tax benefit were also high. By 1995, revenues had increased to $125,000 million and were expected to remain in the range of 16.7% to 16.9% of GDP over the following two years. Over this period, unemployment insurance became the second largest revenue source for the federal government, accounting for 15% of all revenues. With continuing improvement in the economy, however, GST revenues were expected to overtake UI premiums within two or three years. The personal income tax continued to grow in dominance, although part of this trend was masked by federal program and accounting changes.
The 1995 budget introduced little in the way of new tax measures. Excise taxes on gasoline and tobacco were increased, to raise $500 million and $65 million respectively each year. The large corporations tax and the corporate surtax were both increased quite substantially, and a special, temporary capital tax was imposed on large deposit-taking institutions. The financial institutions tax was expected to raise $100 million over two years and the first two taxes were expected to produce over $250 million in revenues each year.
At the personal level, the measures were described as tightening up the system and making it fairer. RRSP contributions were restricted slightly. The deferral of tax on business income was also restricted, to generate $300 million in annual revenues by 1998 while the tax treatment of family trusts was tightened up somewhat. All these revenue measures were expected to raise over $3,600 million over the following three years.
In addition, the government altered the timing of UI premium income so that premiums would not fall as fast as they would otherwise have done. It is the intention of the government to let the UI account amass a cumulative surplus of $5,000 million by the end of calendar year 1996, prior to letting premiums fall in line with expected UI benefits.
The 1996 federal budget contained no new taxes and no increases in tax rates. There was both good and bad news in this. For those who were seeking the end of the GST, the budget had nothing concrete to offer in terms of a new and, better tax. All it offered was the promise that negotiations were continuing with the provinces to seek a reform and harmonization of the GST with provincial sales taxes. Tax rates were not increased but changes to tax rules were introduced which would affect the tax liability of individuals and corporations.
On the personal side, the changes could be categorized into three themes: retirement, education, and social development. The federal government tightened up rules governing Registered Retirement Savings Plans, by denying the deductibility of fees, by controlling the limits on tax-assisted savings, and by reducing the age limit for maturing plans. The budget also reduced the amount of tax assistance for investments in labour-sponsored venture capital corporations, by lowering the tax credit as well as the contribution limit. Because of the generous tax credits available to these investments, as well as their eligibility for RRSPs, they had become extremely popular and were representing a large drain on government revenues. The government also allowed an unlimited carry-forward of unused RRSP room.
In recognition of higher tuition costs in the future; the government provided more generous tax treatment of tuition and education costs; the credits were increased, as was the amount that could be transferred. Registered education savings plan limits were raised and the child care expense deduction altered to make it more beneficial to students with children.
On the social side, the tax system became more favourable to charitable donations, as recommended by the Finance Committee. Tax support for home care was raised and the Working Income Supplement doubled in two stages to $1,000. This last measure was by far the most costly of the tax changes. Arguably the most controversial measure was the change in the tax treatment of child support. Under new rules, the custodial parent would not pay tax on support payments received and the non-custodial parent would lose the deduction on payments made. The new rules applied to court orders or support agreements made as of 1 May 1997, or where existing agreements were changed on or after that date.
These personal tax measures would have little net effect on revenues. One reason was that the government felt it could obtain increasing revenues from the underground economy (as much as $100 million in 1989-99).
The government also introduced corporate tax measures, the most notable of which was the extension of the temporary tax on large deposit-taking institutions (the banks).
Some very significant revenue items were not in the budget. As mentioned above, GST reform/elimination was not achieved. In addition, the budget made no statement on a substantial reduction of employment insurance premiums. Indeed, the statistical information in the budget suggested that such a reduction would not take place during the planning horizon for this budget.
In addition, the government altered the timing of employment insurance premium payments to make it consistent with the practice for CPP premium payments. Previously, weekly premiums were based on the lesser of maximum insurable earnings or actual earnings. As of January 1997, weekly premiums were based upon actual weekly earnings; once the maximum annual premiums were reached, further premium payments ceased. Those who earned maximum insurable earnings or less continued to pay premiums over a 52-week period. Those who earned more paid their premiums over a shorter period of time. Someone earning $80,000 per year paid all of his or her premiums in the first half of the year and nothing in the latter half.
This administrative change had no effect on total premium liabilities of employees and employers. But the timing change did affect the reported government deficit. By advancing premium payments, starting in 1997, the deficit for 1996-97 could be $1,500 million to $1,800 million less than stated in the budget. The impact on future fiscal years would be neutral. Nevertheless, this one-time administrative change could also reduce future debt servicing costs by about $100 million per year.
Nor did the budget take into account proceeds from the sale of assets in 1996-97, in particular the sale of grain hopper cars and the air navigation system. The budgetary impact of these sales depended upon the amount received as well as the accounting treatment of the assets. Newspaper accounts suggested that the gains from sale could be $1,500 million.
This budget offered little in the way of tax measures. The temporary tax on large banks was extended for another year and tobacco taxes were increased somewhat, as announced prior to the budget. Selective tax measures were expected to cost the government about $1,000 million per year by 1999-00. These measures included more favourable tax treatment of education expenses and savings for education. Tax support for Canadians with disabilities was enhanced and the tax treatment of charitable donations was made more generous by increasing the limit for allowable donations and reducing the capital gains tax inclusion rate for certain gifts of appreciated capital property.
The most expensive measure, however, was the enhancement to the Working Income Supplement of the Child Tax Benefit. This was expected to cost the government $600 million per year by 1999-00. The budget altered the WIS by making it conditional upon the number of children in a family -- previously the benefit had not taken the number of children into account. This change was somewhat controversial because some one-child families received less under the revised system than they would have received under the previously promised enhancement to the old system.
The new WIS was complicated because it aimed to limit benefit increases to families with family net income of $25,921 or less. It was seen, however, as only a temporary measure to last until July 1998, when a new National Child Benefit System was expected to be established in co-operation with the provinces.
This budget went to a great deal of effort to rationalize the then existing system of taxes at the federal level. Annex 5 of the budget contained about 25 pages of material explaining and justifying the distribution of the tax burden and the features of the tax system. The Minister’s budget speech spent two pages explaining why broad tax cuts were not being offered at this time but suggesting that the government would reduce personal income taxes when it had more fiscal room to manoeuvre.
Annex 5 addressed a variety of concerns that Canadians had expressed about the tax system. It talked about the relative burden faced by corporations and indicated that, contrary to popular belief, the effective tax rate on corporations had not declined appreciably in the last three decades; rather, a greater reliance on corporate capital taxes had had the effect of establishing a minimum tax on corporations that had stabilized the effective rate.
The personal income tax was shown to be progressive, especially if the Child Tax Benefit and the GST credits benefiting primarily low income families were taken into account; as family income increased, so did the absolute and relative burden of the income tax. Also in this vein, the budget defended the absence of a wealth tax; taxes on investment income were said already to be high and since such a tax would be primarily aimed at the rich, the government felt it was felt it was better to use other measures to ensure that the tax system was fair. Cases where high income individuals paid no tax were explained as exceptional and temporary occurrences that did not change the basic characteristics of the PIT’s incidence.
The most interesting aspect of the Annex was its discussion of payroll taxes. The federal government had been under intense and persistent criticism for its apparent change in policy with respect to EI premiums. It had originally planned to allow the cumulative EI Account surplus to reach about $6,000 million so as to provide a buffer for any upcoming recession. It now appeared that the surplus would reach about $12,000 million by the end of 1997-98; however, neither the new budget nor previous budgets gave any indication that significant premium cuts were in the offing. Thus the surplus was expected to continue to grow by close to $5,000 million per year. (Every $0.10 cut in premiums costs the federal government $700 million in lost revenues.)
Annex 5 showed clearly that Canada’s use of payroll taxes paled in comparison to that of many other countries -- it was even less than that of the United States. The annex also argued that the job-killing aspect of payroll taxes resulted not from their level but from the tendency to increase rates during a recession, something that would no longer be expected to happen with Canadian EI premiums because of the accumulated surplus. The federal government seemed to be hinting broadly that future EI premiums could constitute just another form of tax, contributing to overall revenues rather than just funding EI-related programs. An efficient and flexible tax system, according to these documents, was one that relied upon a variety of sources to collect revenues.
J. The Debate about EI Premiums
The government’s use of EI premiums in combating the deficit came under increasing attack, as these payroll taxes were frequently viewed as "job killers." It was expected that the EI account might achieve a cumulative surplus of $20,000 million by the end of 1998, unless premiums were reduced. The government’s chief actuary counselled that a cumulative surplus in the range of $12,000 million to $15,000 million would protect against the necessity of raising premiums during a future recession, thus undermining a major rationale for keeping premiums high. The actuary’s report further stated that premiums could be reduced to $2 from the current $2.90 (costing about $6,500 million) and still guarantee against future increases during a recession. Thus it seemed the government would soon be faced with the prospect of making EI premiums a tax like any other, or significantly lowering their rate to make premiums consistent with annual costs.
The government maintained its position that any major tax reduction would not come until the budget was balanced. EI premiums had been reduced slightly in the past and a further reduction of at least 10 cents was slated for 1998, though this was far less than critics were demanding. In the 1998 budget, the federal government succeeded in eliminating its deficit. Surpluses have been used to pay down the debt, to eliminate the surtax and to increase specific program spending. Together, the 1998 and 1999 budgets will give workers a $1,100 million cut in EI premiums. These reductions mean that, after reaching a peak of $3.07 per $100 in 1993, EI premiums were reduced to $2.40, effective 1 January 2000.
Revenues for 1997-98 were nearly 9% higher than in the previous year with economic growth unexpectedly high at the beginning of the year. Moreover, the unemployment rate saw one of its lowest levels in eight years and consumption spending increased, explaining the high growth in revenues.
Though this budget offered more in the way of tax relief than the budget of 1997, the extent of relief was still very limited. The temporary tax on large banks was again extended and tobacco taxes were increased somewhat, as had been announced prior to the budget. General tax relief measures were expected to cost the government a cumulative total of $12,815 million to the year 2001-2002.
The maximum child expense deduction was increased to $7,000 for children under the age of seven and $4,000 for older children. Most of the targeted measures were for post-secondary students or graduates, and their families. There was tax relief for interest on student loans, tax-free RRSP withdrawals for lifelong learning, and tax relief for part-time students. Measures were also introduced to assist caregivers, people with disabilities, and volunteers. This budget permitted the unincorporated self-employed to deduct the cost of supplemental health and dental insurance premiums from their income, thereby putting them on a par with incorporated self-employed individuals.
The promised increase in Child Tax Benefits was introduced, accounting for 15% of all tax relief. But is this really tax relief? The CTB could rather be viewed as program spending delivered, merely as a matter of administrative convenience, via the tax system; it could just as easily be delivered in the form of monthly benefits from Health and Welfare Canada. The fact that it is subject to an income test makes it no more of a tax measure than the Guaranteed Income Supplement. In fact the previous government had considered the benefit in just this way; by reducing the program spending limits under the Spending Control Act to offset the effects of converting the Family Allowance (a spending program) into the Child Tax Benefit, it was recognizing that the CTB constituted a form of disguised spending.
Although the CTB is provided for in the Income Tax Act, the benefits are in no way linked to taxes otherwise payable; it is a refundable tax credit, with much of the benefit going to those who pay no income tax. Does the concept of tax relief have any meaning, if it can be targeted to those who pay no tax?
The 1998 budget also appeared to be inconsistent in its treatment of the CTB. If the proposed increase in benefits is considered to be tax relief, then logic dictates that the existing benefits also be viewed in that way. It is claimed that a budget measure that increases by $500 the amount that can be earned free of income tax would remove 400,000 Canadians from the tax rolls and reduce the tax payable by another 4.6 million Canadians. These low-income individuals said to be removed from the tax rolls, however, were typically net beneficiaries of the tax/transfer system; if we think it as one "tax" system, they were already off the tax rolls.
The two measures that provided general tax relief in this budget were the supplement allowing low-income Canadians to earn an additional $500 before paying tax and the provision that reduced or eliminated the 3% surtax for the majority of taxpayers.
The impact of the two measures can be thought of as follows: 1) no change to the basic structure of the personal income tax or its surtaxes; 2) a lump sum gift of $85 to anyone earning $6,956, reduced by 0.68 cents per dollar of income above that level; and 3) a lump sum gift of up to $250 for a taxpayer with $8,333 in basic federal tax, with this gift reduced by 6 cents for every dollar of tax above this amount.
According to this view, taxpayers could be said to be better off, in the sense that they paid less tax overall; yet, at the same time, they were facing a higher tax rate on any additions to their income. This is an example of how marginal tax rates can be increased by using a complex mechanism to reduce average tax burdens. The strategy is reminiscent of the features of the proposed Seniors Benefit (now withdrawn) under which seniors with low and middle incomes would have been as well off as before, or even better off, but would have faced substantially higher marginal tax rates, with serious adverse effects on their incentives to save for retirement.
In the federal government’s quest to keep general tax relief away from higher income taxpayers, the 1998 budget introduced further complexity into an already complex income tax system and created further disincentives to work and save.
In view of the previous year’s good news about elimination of the deficit, taxpayers this year were anticipating some tax relief. Obviously, the federal government saw things differently, even though the 1999 budget was balanced. Warning that Canada should continue to be careful, since the world economic turmoil was not over, Finance Minister Paul Martin did not announce the tax reduction for which Canadians were waiting, though he introduced some new tax measures. In July 1999, the 3% surtax that had been put in place to finance the deficit was eliminated for everyone, for a total tax reduction of $7.7 billion over the next three years. EI premiums, a payroll tax, also decreased to $2.55 – $0.52 less than when premiums peaked in 1993.
The federal government proposed spending considerable amounts on healthcare, some $11.5 billion over the next five years. From this total, $8 billion was to go to the Canadian Health and Social Transfer (CHST) and $3.5 billion was to serve as an immediate one-time supplement to CHST. As noted by the Finance Department, the value of CHST tax transfers was expected to reach a new high by 2001-2002, passing their level prior to the imposition of restraints in the mid-’90s. Total program spending was to account for 12.6% of GDP this year.
Even with this new spending, the federal government said that the downward trend with respect to the deficit and the debt would be maintained, the budget should be balanced, and a surplus could perhaps be expected. According to these expectations, the debt/GDP ratio should decrease from 65.3% in 1998-1999 to 62% in 2000-2001. This situation was in marked contrast to that of 1995, when the debt/GDP ratio was 71.2%.
The budgetary process started on a promising note with the presentation in November of the 1999 Economic and Fiscal Update. The Minister of Finance announced budgetary surpluses that would increase over a five-year horizon under the current tax structure.
Taxpayers benefited from significant tax relief in the 2000 budget, which introduced the most important structural changes in tax policy since the tax reform of 1987. The Minister took this opportunity to present a five-year tax plan dealing mainly with personal income tax, worth about $58 billion over the next five years.
The most significant measure was the restoration of full indexation to tax brackets and basic exemptions, effective retroactively to 1 January 2000. This measure was also extended to the Child Tax Benefit and GST Credit.
The middle tax rate was lowered to 24% from 26%, effective 1 July 2000. Also effective at that date, the income threshold for the 5% surtax will be raised to about $85,000. The 5% surtax itself will be not entirely eliminated before 2004.
Additional budgetary measures included an increase in the foreign content allowed in registered retirement savings plans (RRSPs) and registered pension plans (RPPs) to 25% for 2000 and 30% for 2001.
Even though priority was given to personal income tax, business tax changes were also included in the budget. For the next five years, the general corporate tax rate will be lowered from 28% to 21%, starting with a one-point reduction to 27% effective 1 January 2001.
Another major initiative is the reduction in the percentage of capital gains subject to tax, from 75% to 66%, effective for capital dispositions realized after 27 February 2000.
To lighten the effect of taxation, gains on certain employee stock options in public company shares will be taxed when the shares are sold (instead of when the option is exercised).
As a result of the measures effective in 2000, tax revenues were projected to experience slower growth, with budgetary revenues falling to 16.2% of GDP.
The public debt-to-GDP ratio is expected to fall to 50% by 2004, a goal that can be achieved if the present good economic conditions continue.
Parliamentary involvement in the funding of government spending typically involves the examination and passage of legislation arising from government budgets, which are usually presented once a year. The tax reform legislation that Parliament proposed in the latter part of the 1980s did not arise from budgets.
1962 - The Royal Commission on Taxation was established under the Chairmanship of Mr. Kenneth Carter.
February 1967 - The Carter Commission submitted its report. It proposed a dramatic restructuring of the Income Tax Act to broaden the base, lower maximum rates and integrate personal and corporate income taxes.
November 1969 - The federal government tabled a White Paper on Tax Reform in response to the Carter Commission.
February 1973 - The Minister of Finance introduced a permanent system of indexation for income tax brackets and exemptions.
November 1974 - The Minister of Finance introduced the Registered Home Ownership Savings Plan (RHOSP), provisions to shelter pension income and dividend income from tax, and increased the personal income tax reduction.
August 1978 - The government announced the introduction of a refundable Child Tax Credit to be delivered to families eligible to receive the family allowance. The CTC essentially delivers a targeted form of family allowance. It is not considered to be an expenditure in the usual sense of the word; rather it is a tax expenditure.
December 1979 - The Conservative government’s aborted budget introduced two notable tax-related measures: an increased tax on gasoline (18 cents per gallon) and a measure of mortgage interest and property tax relief for federal income taxpayers. Neither measure passed into law. That budget also contained, for the first time, an analysis of federal tax expenditures.
November 1981 - The Minister of Finance attempted to eliminate a number of tax shelters but had to retreat in the face of much opposition.
June 1982 - In line with the government’s attempts to control inflation, indexation of the tax system was limited to 6% for 1982 and 5% for 1983.
October 1982 - The Minister of Finance was presented with a proposal to shift the manufacturers’ sales tax to the wholesale level.
April 1983 - The flow through research and development tax credit was introduced; this would prove to cost the government far more in lost revenue than originally anticipated. Deductions for RHOSP contributions were made significantly more generous for purchasers of homes or appliances and furnishings in 1983. The deduction for child care expenses was also increased.
May 1985 - Partial indexation of the tax system was introduced.
June 1986 - The federal government tabled its White Paper on Tax Reform.
1988 - Stage I of tax reform was implemented. The proportion of capital gains subject to tax was increased from one-half to three-quarters, starting in 1990.
August 1989 - The government introduced its Technical Paper on the Goods and Services Tax.
December 1989 - The government introduced Bill C-62, which would implement the GST.
April 1990 - Bill C-62 passed third reading in the House of Commons and was subsequently sent to the Senate where it was referred to the Standing Committee on Banking, Trade and Commerce for study.
September 1990 - The Standing Senate Committee on Banking, Trade and Commerce tabled its Report on Bill C-62 with a recommendation that the Senate reject the GST.
October 1990 - The Senate passed Bill C-28, which provided for a special tax on OAS and family allowance benefits received by higher income Canadians. This bill also introduced a tax which had the effect of imposing a minimum tax on large corporations.
December 1990 - The Senate passed Bill C-62 without amendment. It received Royal Assent within one week.
1 January 1991 - The GST came into effect as planned. The Quebec retail sales tax on goods was harmonized with the GST, although the Quebec government offered a tax rebate on the purchase of books.
- The federal budget contained little in the way of tax initiatives. Taxes on tobacco products were increased substantially and UI premiums for employees were raised to $2.80 per $100 of insurable earnings. The employer’s share was increased to $3.92 per $100 of insurable earnings.
December 1992 - The Minister of Finance tabled an economic and fiscal statement in the House of Commons which admitted to a net debt increase over two years of $17,000 million over projections in the 1992 budget.
April 1997 - The GST and provincial sales taxes were harmonized into a 15% HST in Newfoundland, Nova Scotia and New Brunswick.
February 2000 - Broad tax relief was initiated in Budget 2000, over a five-year period. Full indexation of tax rates and credits was restored.
Allan, J.R. et al. "The Effects of Tax Reform and Post-Reform Changes in the Federal Personal Income Tax, 1972-75." Canadian Tax Journal, Vol. XXVI, No. 1, January-February 1978, p. 1-30.
Boadway, R.W., and H.M. Kitchen. Canadian Tax Policy. Second edition. Canadian Tax Paper No. 76. Canadian Tax Foundation, Toronto, 1984.
Brooks, W. Neil. Ed. The Quest For Tax Reform - The Royal Commission on Taxation Twenty Years Later. Carswell, Toronto, 1988.
Canada, Department of Finance. The Budget. Ottawa, various years.
Davies, J., F. St. Hilaire, and J. Whalley. "Some Calculations of Lifetime Tax Incidence." American Economic Review, Vol. 74, No. 4, September 1984, p. 633-49.
Due, John F. "The New Zealand Goods and Services (Value-Added) Tax - A Model for Other Countries." Canadian Tax Journal, Vol. 36, No. 1, January/February 1988, p. 126-144.
Maslove, A. M. Tax Reform in Canada: The Process and Impact. The Institute for Research on Public Policy, Halifax, Nova Scotia, 1989.
OECD. OECD Economic Surveys - Canada, 1997. Paris. 1997.
Perry, J. Harvey. Taxation in Canada. Fourth edition. Canadian Tax Paper No. 74. Canadian Tax Foundation, Toronto, 1984.
Perry, J. Harvey. A Fiscal History of Canada - The Postwar Years. Canadian Tax Paper No. 85. Canadian Tax Foundation, Toronto, 1989.
Poschmann, Finn. "How Do I Tax Thee? Choices Made on Federal Income Taxes." C.D. Howe Institute, 25 February 1998.
Purvis, D.D., and C. Smith. "Fiscal Policy in Canada: 1963-1984. "In J. Sargent, Research Coordinator, Fiscal and Monetary Policy. Volume 21. Collected Research Studies of the Royal Commission on the Economic Union and Development Prospects for Canada. University of Toronto Press, Toronto, 1986, p. 1-42.
Salyzyn, V. The Economic Analysis of Taxes. Detselig Enterprises, Calgary, 1985.
Vaillancourt, F. The Administrative and Compliance Costs of the Personal Income Tax and Payroll Tax System in Canada, 1986. Canadian Tax Paper No. 86. Canadian Tax Foundation, Toronto, 1989.
* The original version of this Current Issue Review was published in May 1990; the paper has been regularly updated since that time.